Portfolio Builder
Build, Test & Monitor All-ETF Portfolios
Portfolio Builder is an interactive tool that allows you to build, test and maintain all-ETF portfolios, and see how they compare to any benchmark you choose in terms of allocation, performance, fundamentals and valuation.
Log-in/Subscribe to use Portfolio Builder. Start your Free trial.
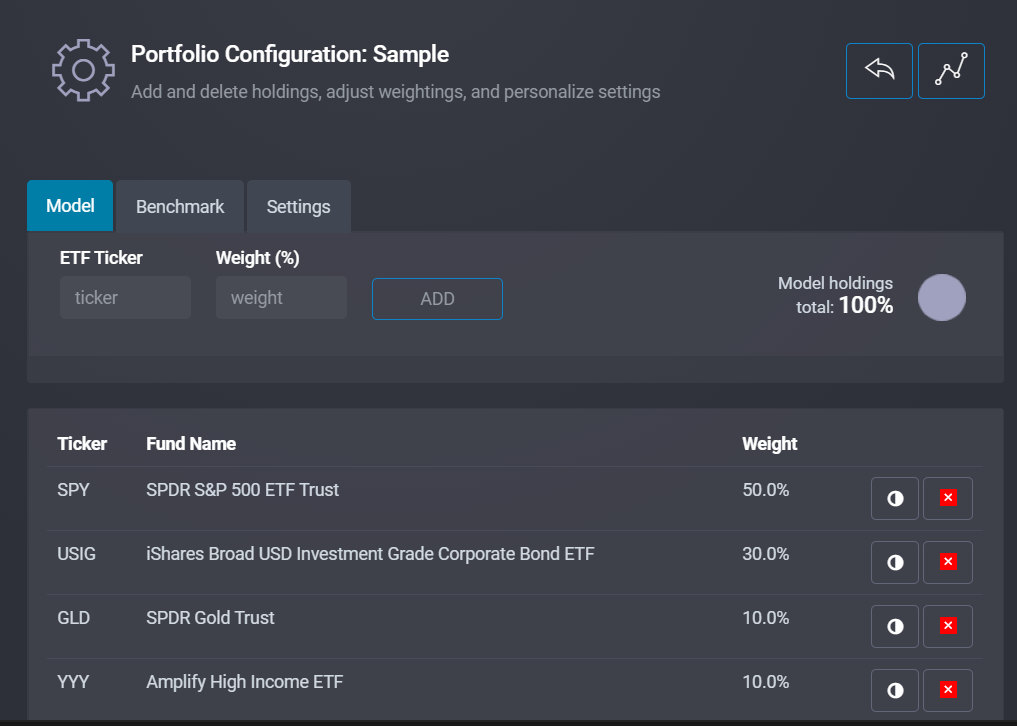
1. Choose Your Funds
Create a new portfolio or modify an existing one on the My Portfolios page.
Click the configuration icon and then enter your ETFs by ticker symbol along with their desired portfolio weight. You
can stay within an asset class or mix equity, fixed income, commodity or other ETFs.
Follow the same steps to construct a custom benchmark, or simply select a broad fund such as the S&P500 SPDR (SPY)
at a weight of 100%. You can also change other portfolio settings on the 'Settings' tab.
Once satisfied, click on the Analyze icon to see your Portfolio Analysis.
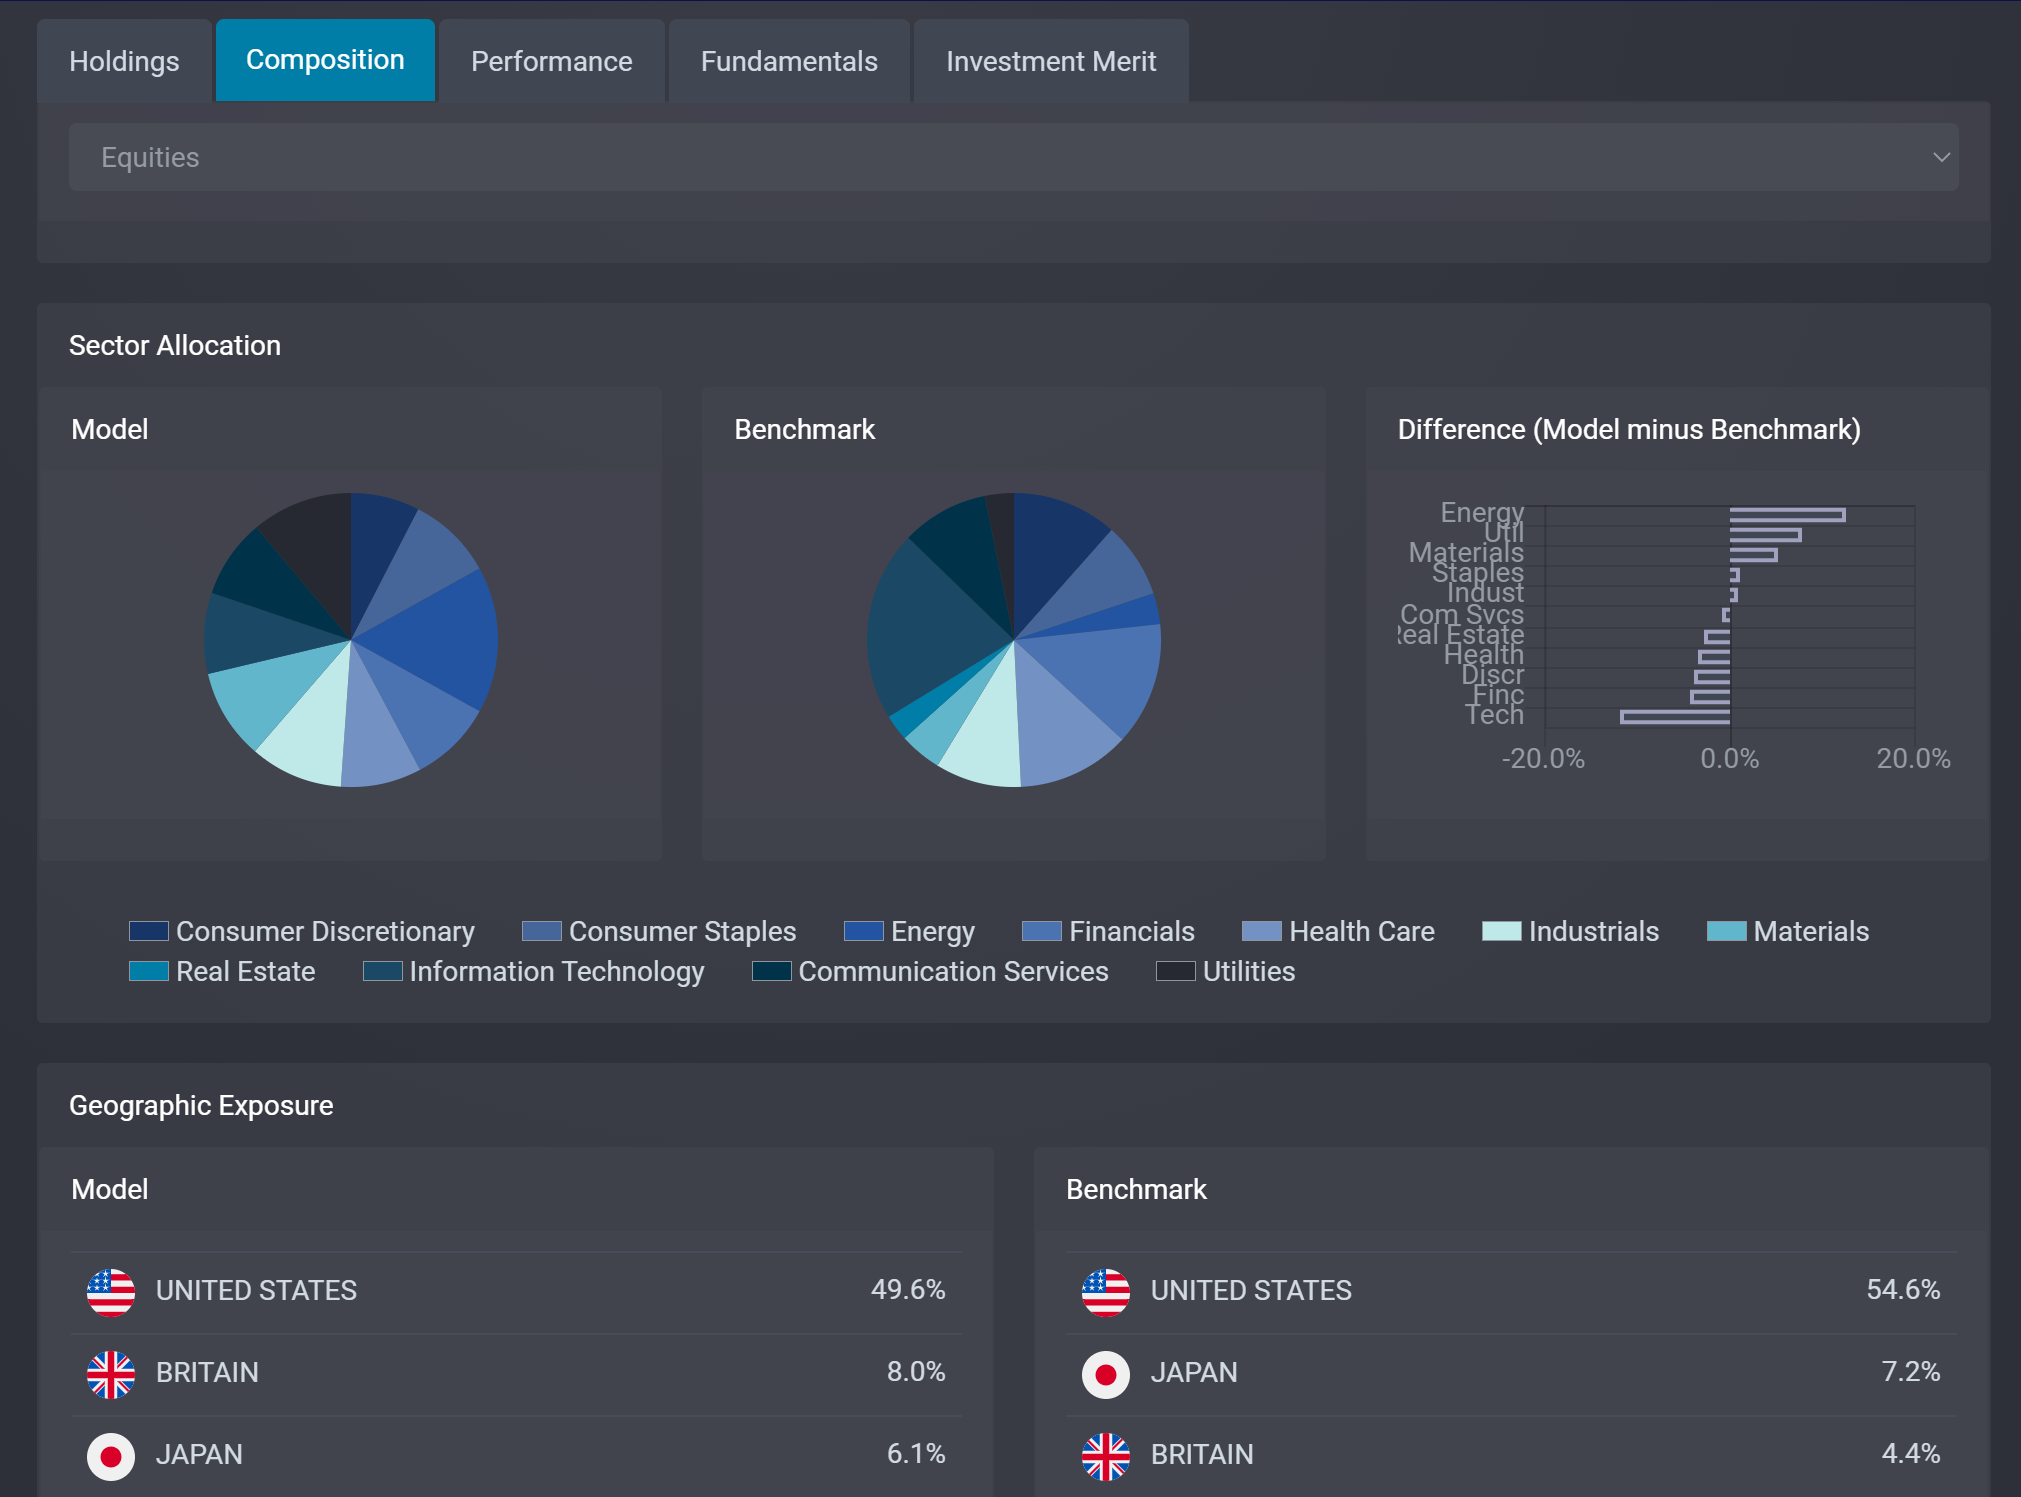
2. Understand Your Asset, Sector & Geographic Allocation
Quickly see how your portfolio compares to the benchmark in terms of overall
asset allocation, sector allocation — including relative overweights and underweights — as well as geographic distribution and issuer type (for fixed income ETFs).
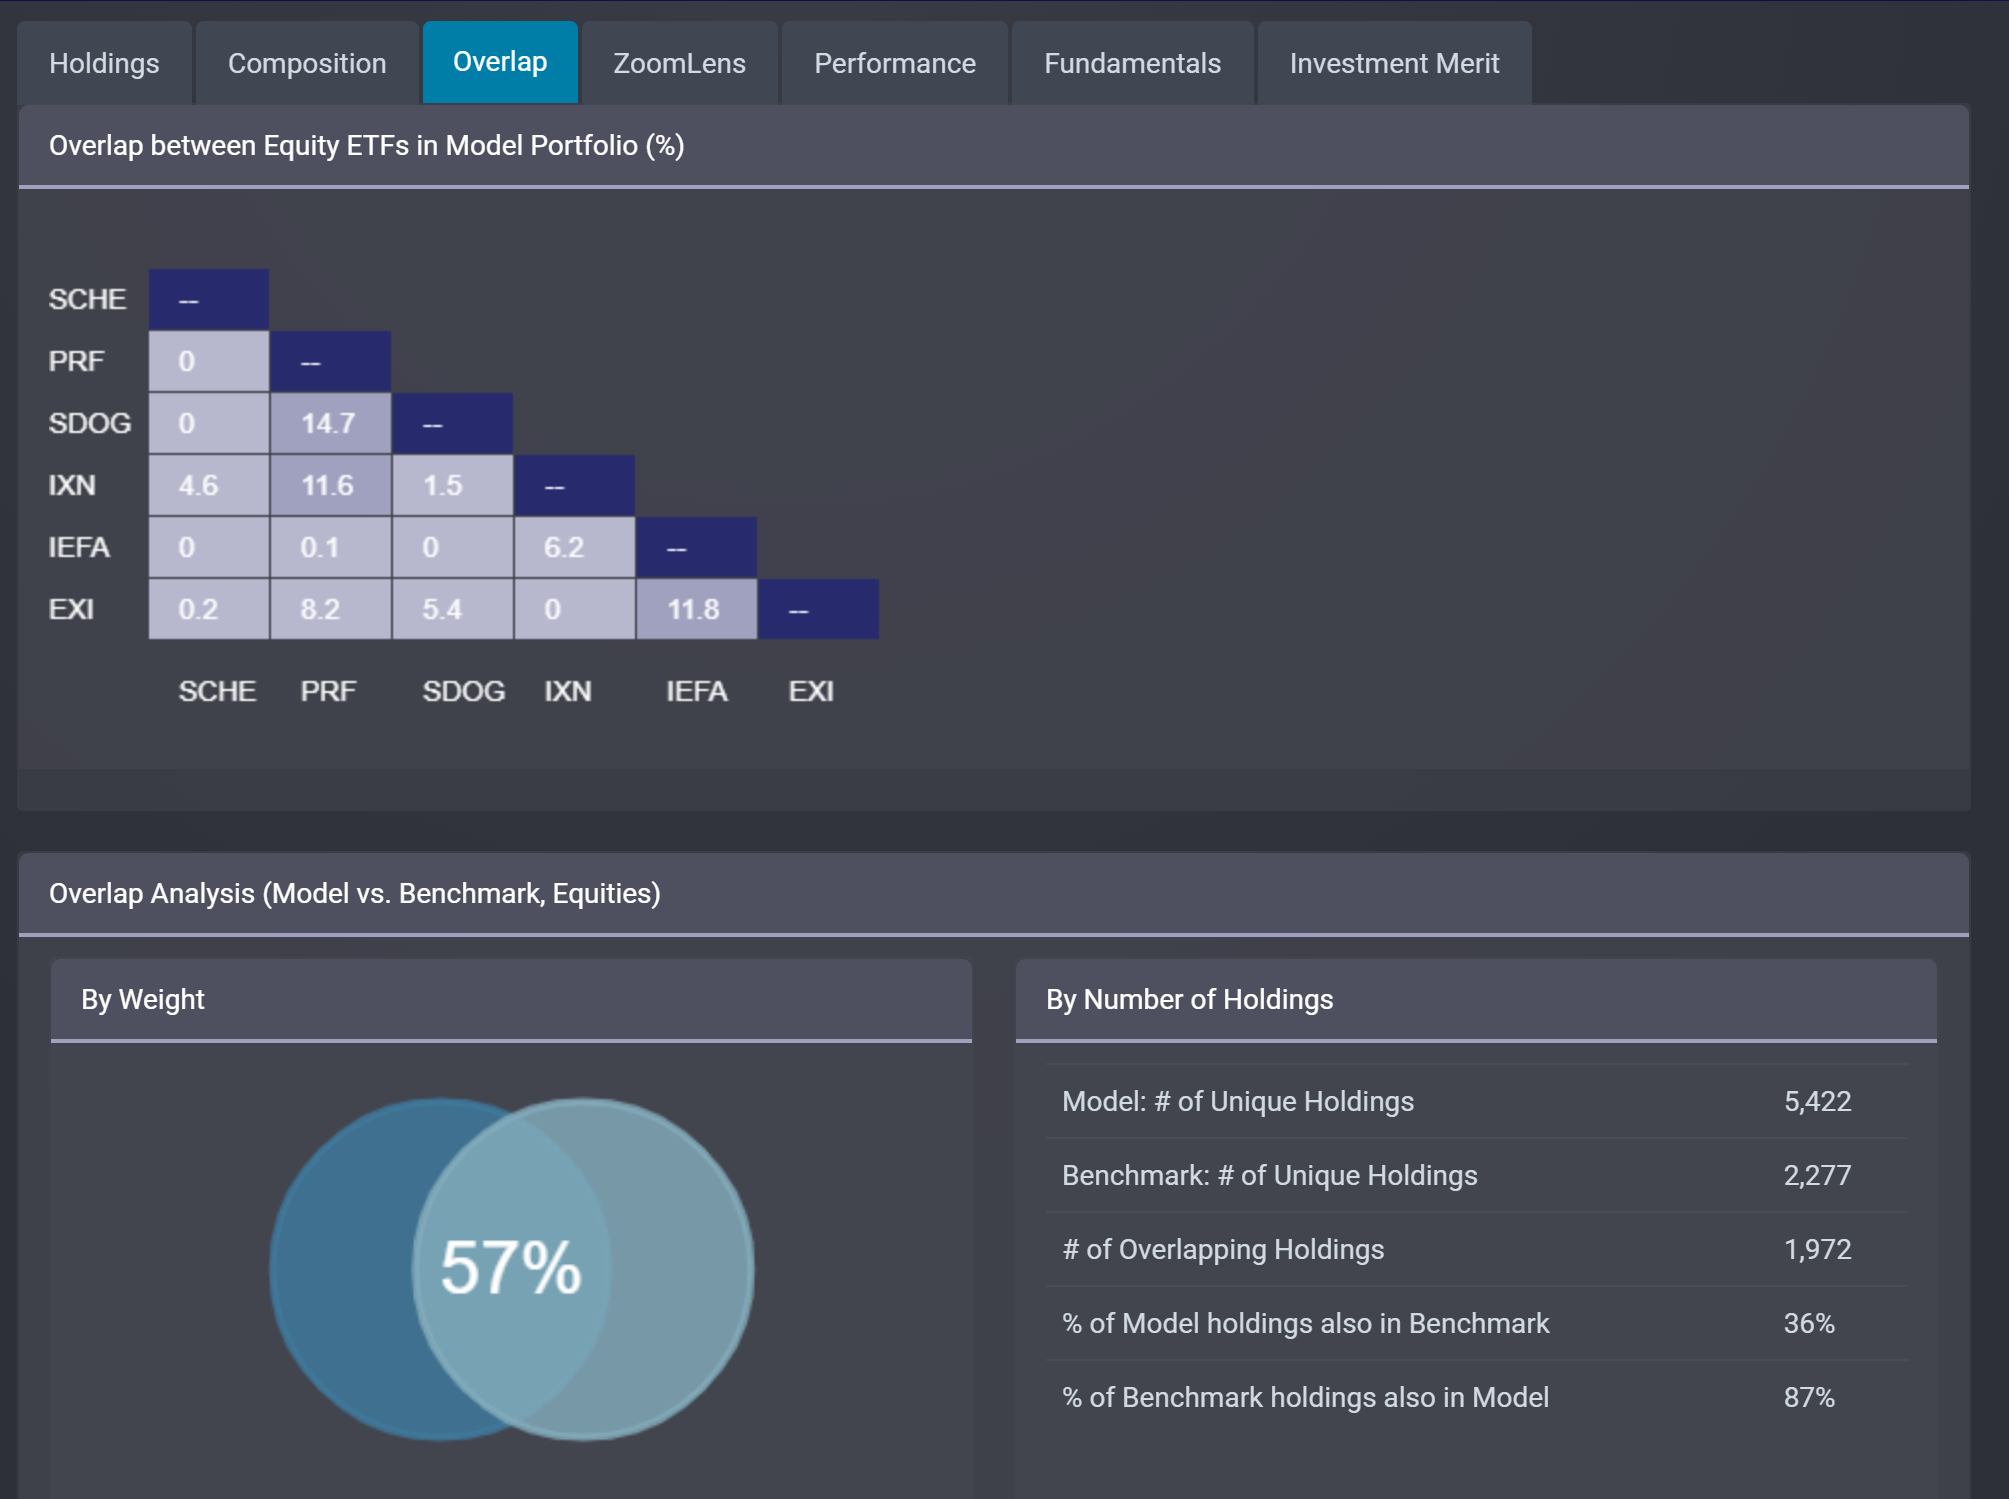
3. Get a Detailed Overlap Analysis
See an overlap matrix detailing how much each
equity ETF in your portfolio overlaps with all others. Funds with high overlap are highlighted for your
consideration.
Scroll down for a detailed view of how much your model portfolio overlaps with your chosen benchmark. Included
is data breaking down the overlap in aggregate, as well as top 10 overlapping positions and the top 10
overweights and underweights-- which by definition are what will determine differences in returns.
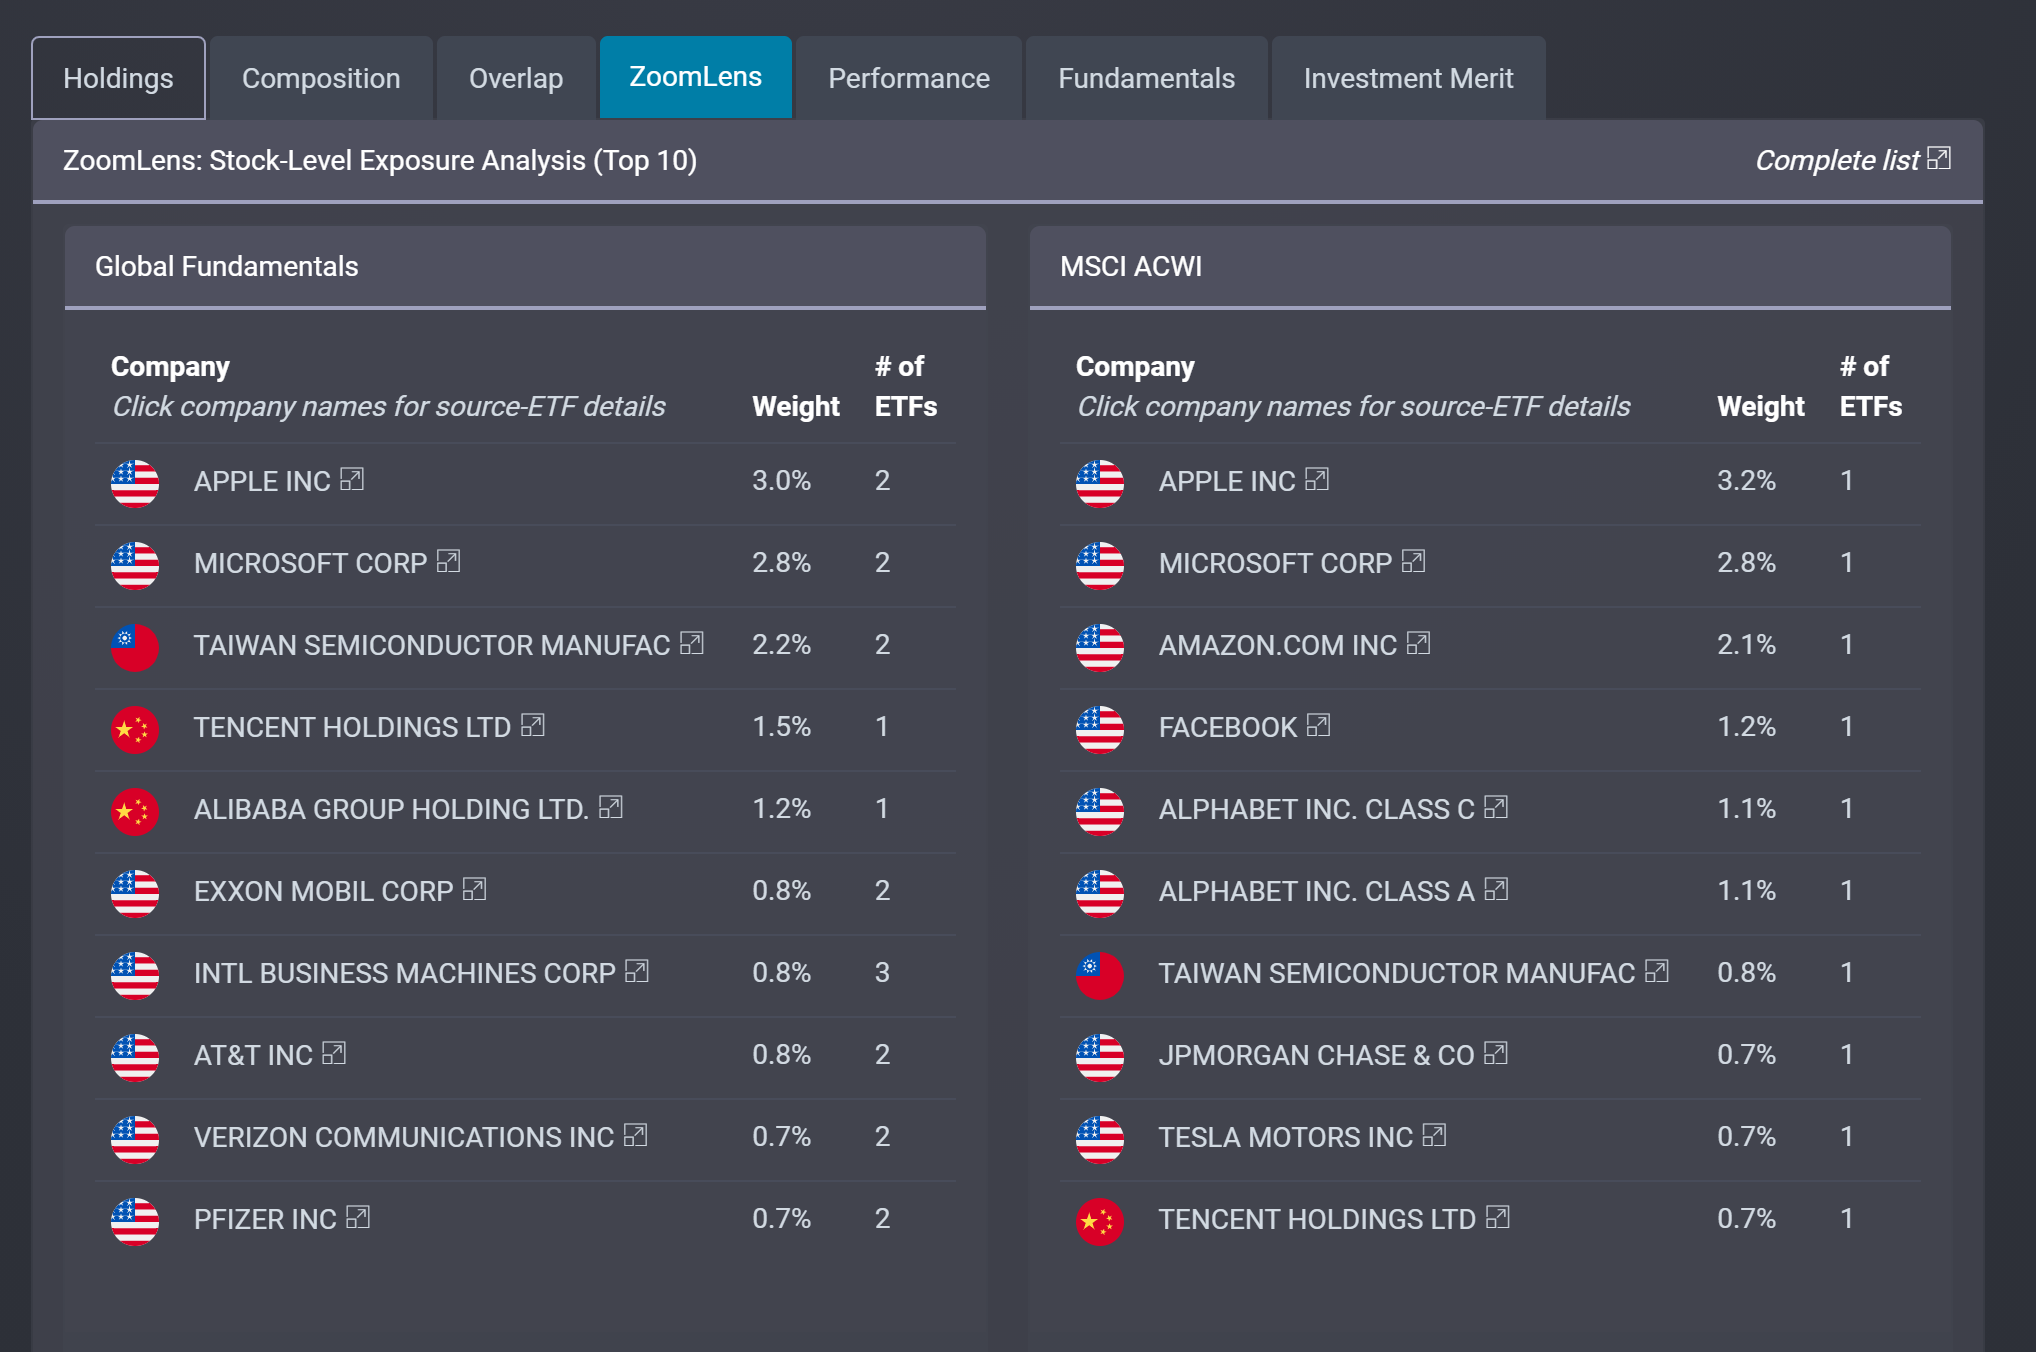
4. Zoom-In with ZoomLens
Understand your true exposures with a full, searchable and exportable list of
underlying equity holdings. If you find an unexpected or undesirable concentration in a given stock, you can quickly drill down
to see which ETFs contribute to that exposure, and adjust your portfolio accordingly.
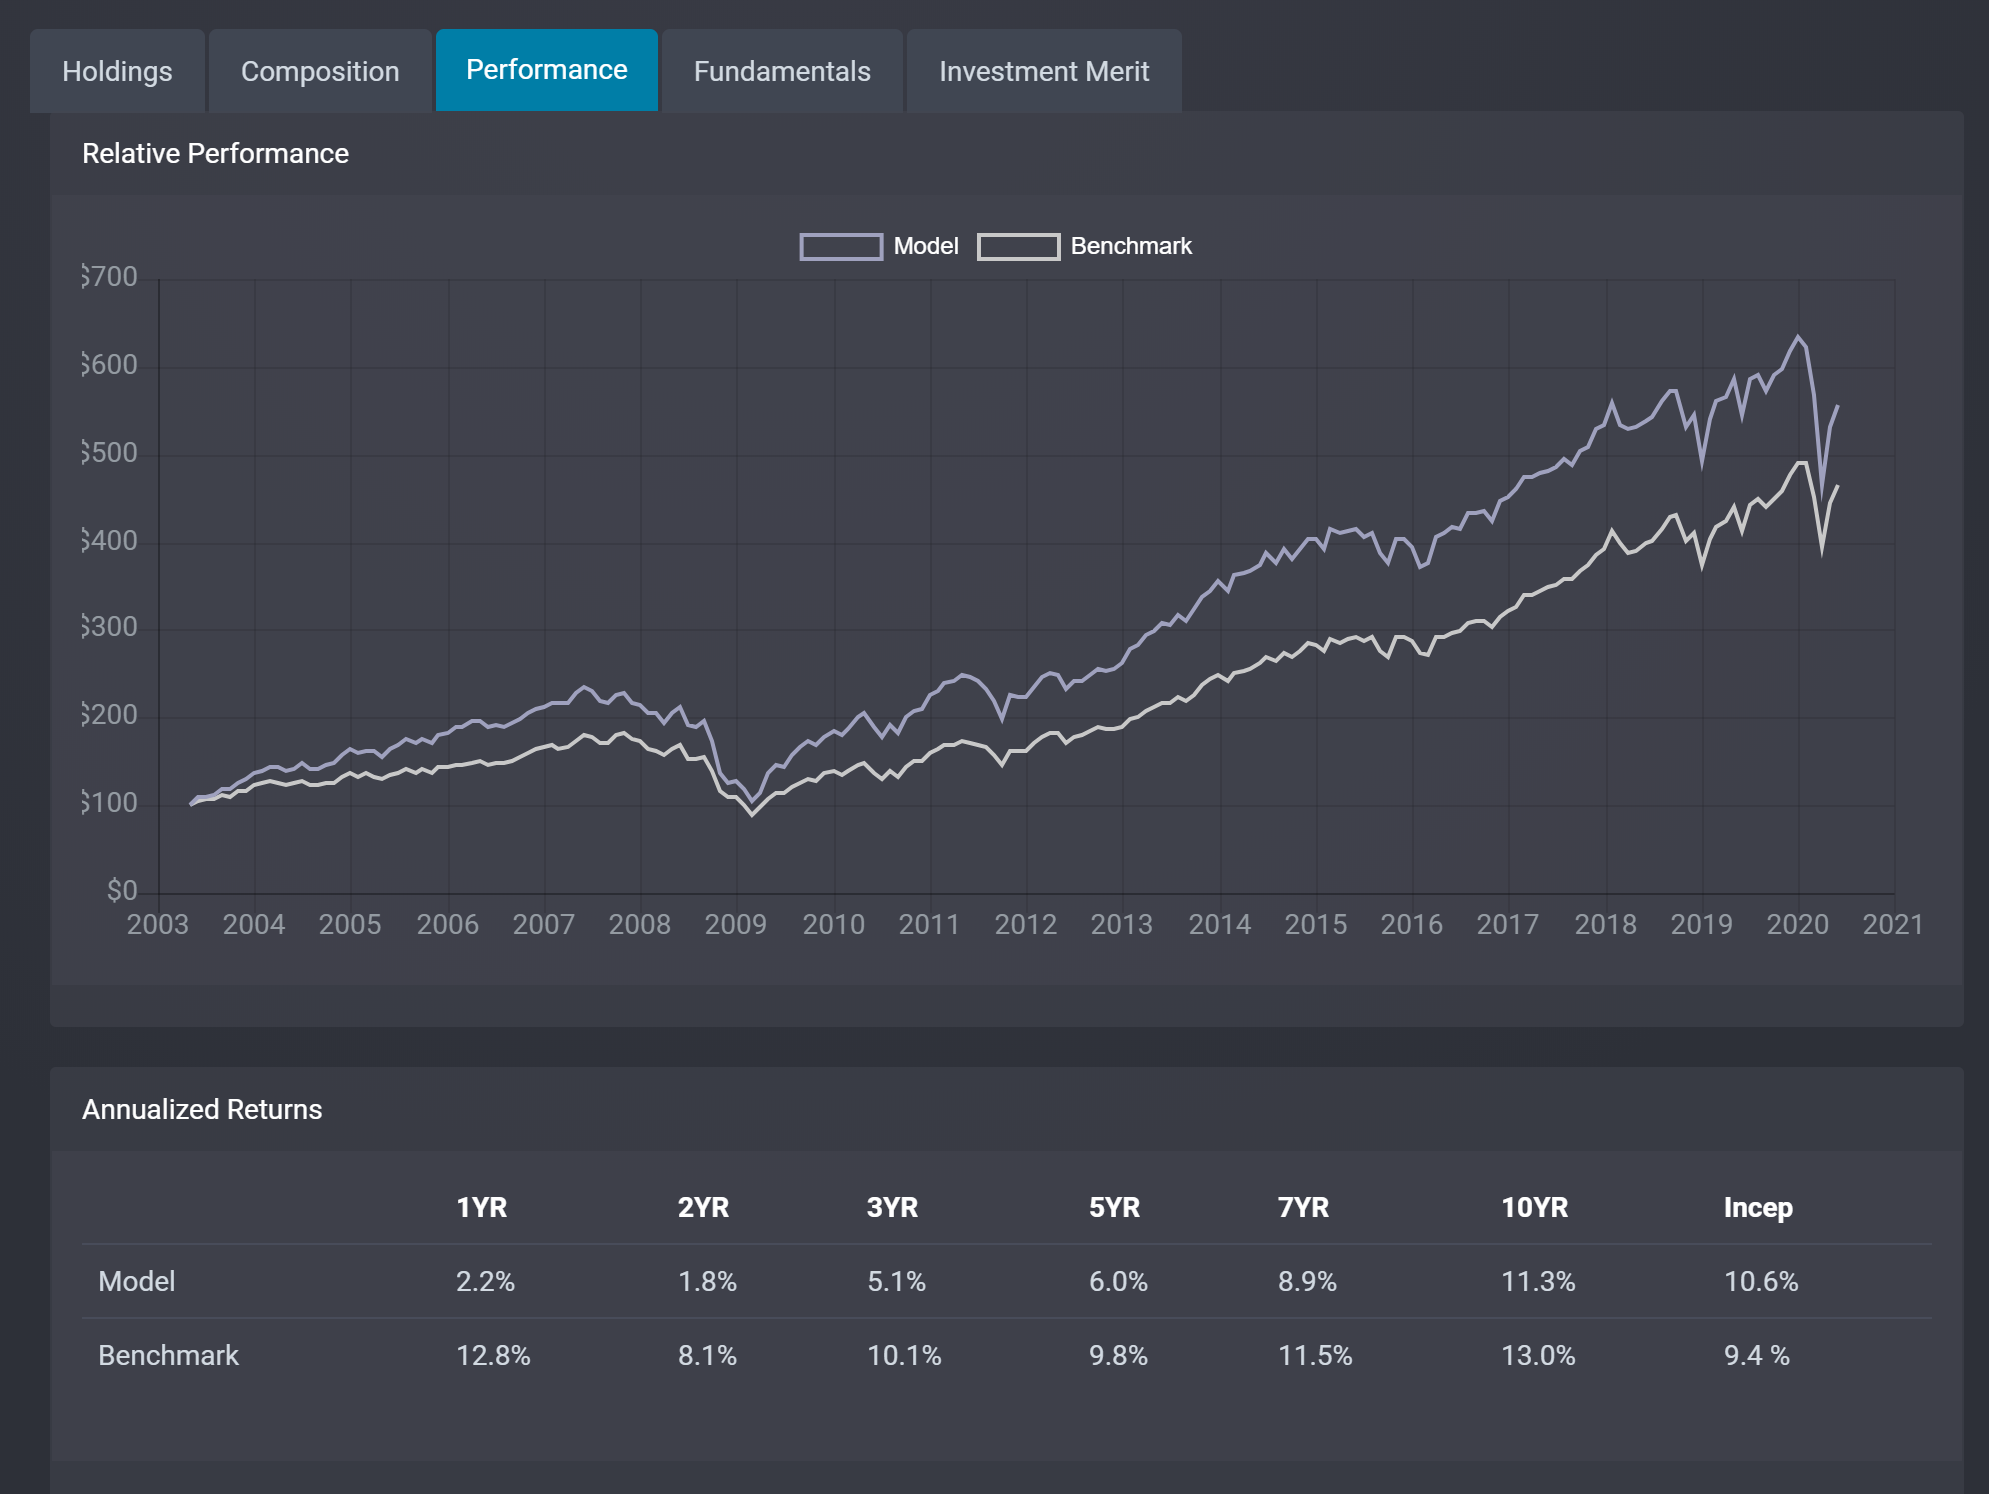
5. Test your Strategy
Get a hypothetical backtest to see how your portfolio might have performed in the
past. We'll also show you risk and return metrics so you can see where the performance is coming from. Pro tip: Don't
reject a portfolio that may have lagged in the past. Those ETFs might be ripe for outperformance!
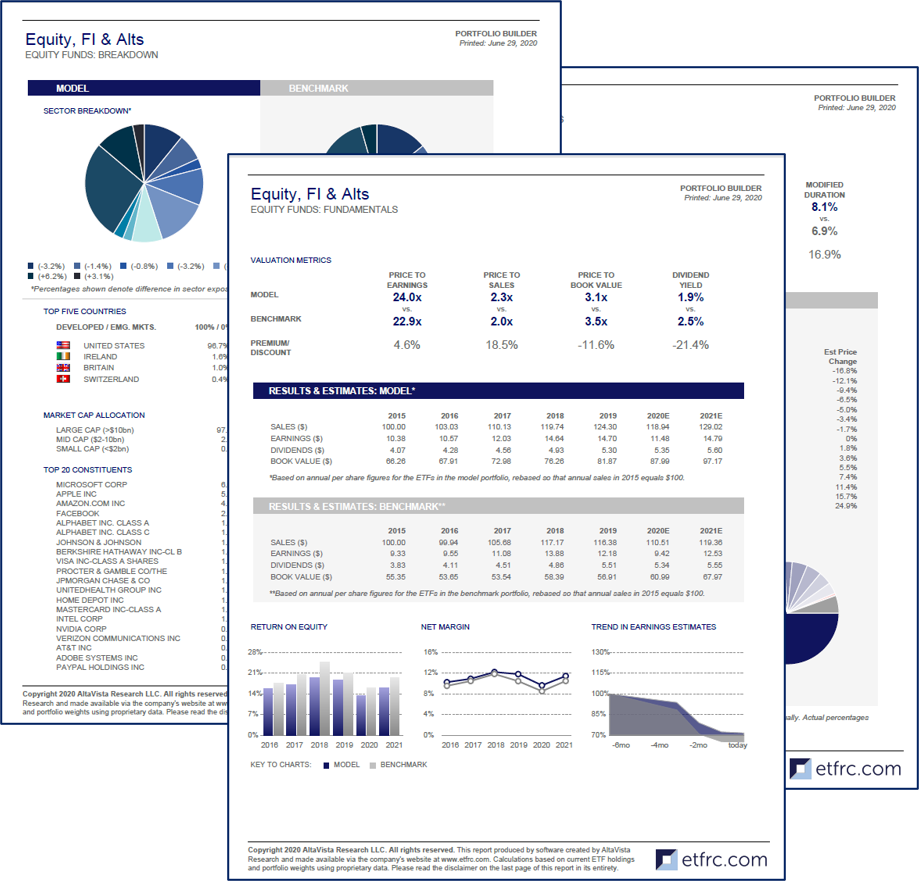
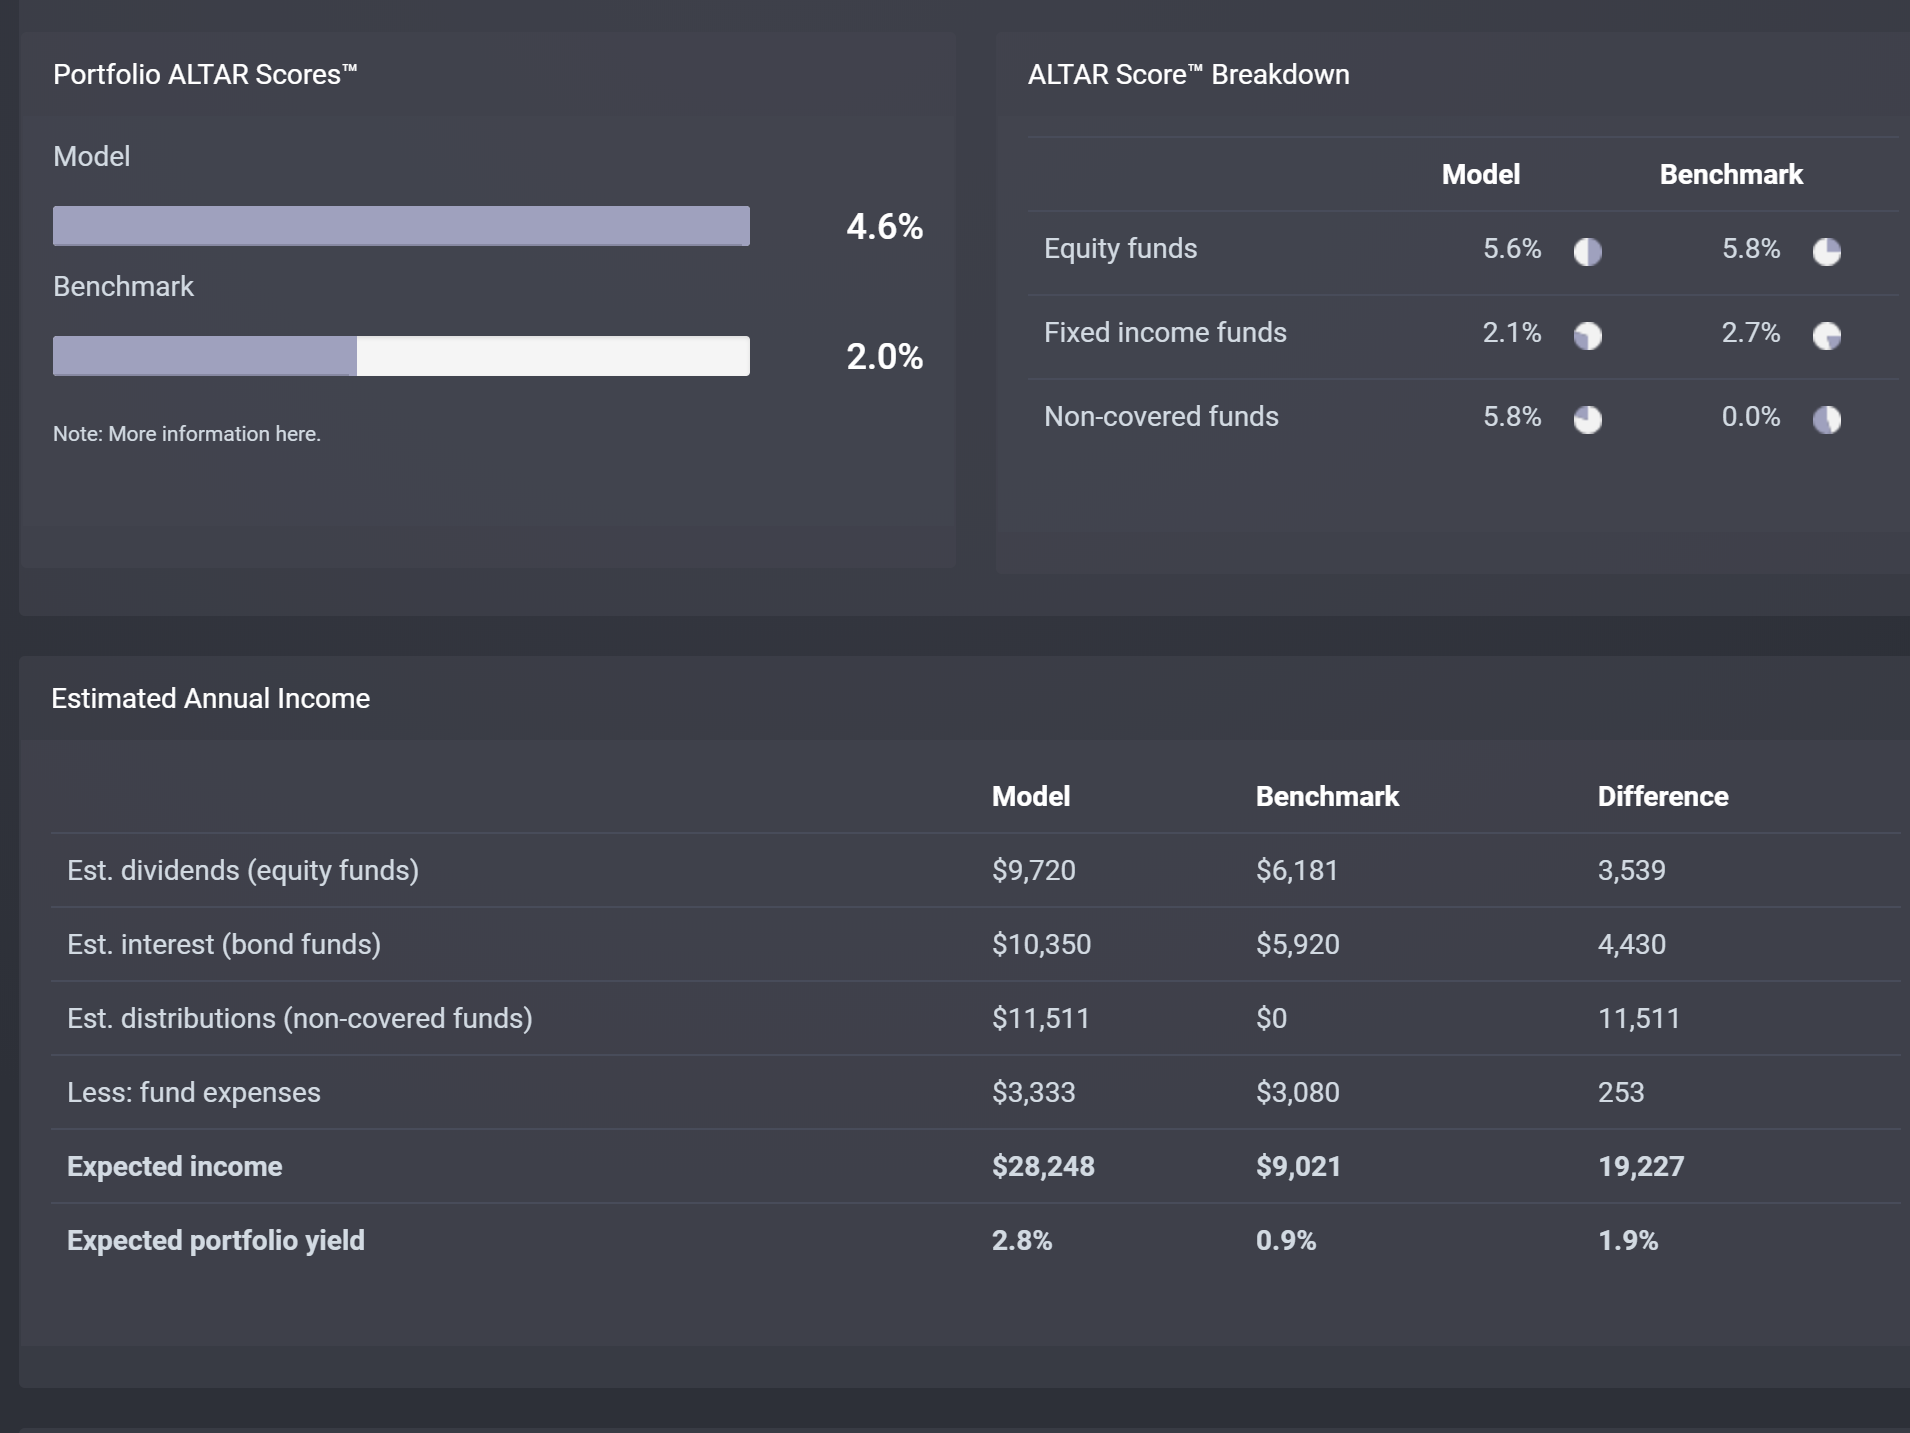
6. Focus on Fundamentals
Fundamentals give us a window into future performance. Portfolio
Builder aggregates all the fundamentals, valuation and ratings data we compile for individual ETFs so you can
evaluate how your model portfolio compares to its benchmark. Go back and adjust your ETF selections and weights
until the portfolio has the characteristics you want.
7. Print Custom PDF Reports
Download and print customizable PDF reports ideal for
presentation to clients. The detailed information on each portfolio demonstrates to clients the effort and due
diligence the goes into proper ETF porfolio construction (Professional subscribers only).