Week Ending September 23, 2022
Last week was another rough one for equities across the board. Large caps in the S&P 500 SPDR (SPY) sank 4.6% while mid- and small-caps fell even more. Foreign shares tanked as well, with losses exacerbated in part by strength in the U.S. dollar.
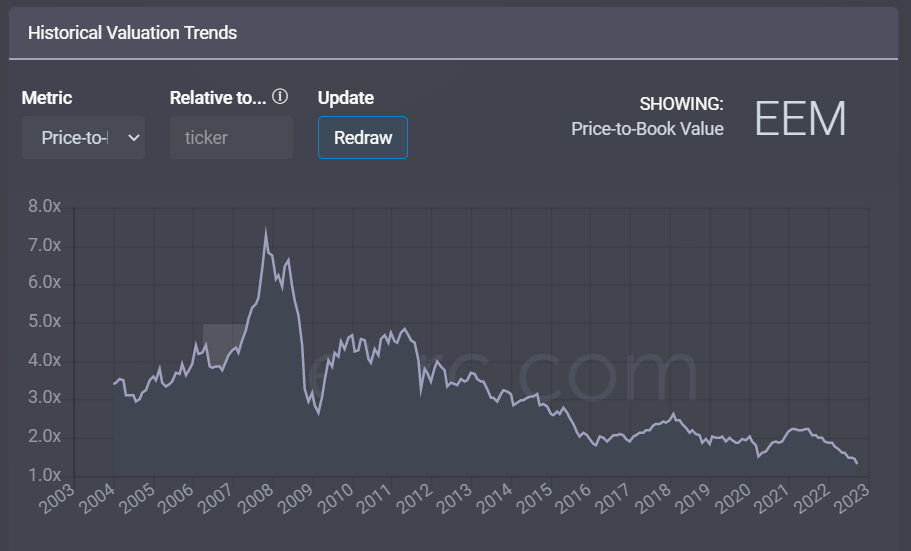
For this week’s valuation update we posted each ETF’s forward price-to-book value (P/BV) multiple. Unlike with many other valuation multiples such as P/Es, all major equity benchmarks are trading at a discount to their 10 year averages. Emerging Markets in particular trade at a large, 44% discount to their historical average, and in fact at just 1.3x, their lowest level since at least 2004 (chart below).
TABLE 1: Major Benchmarks: Weekly Total Returns and Valuation Update
Week ending September 23, 2022
| Ticker | Fund | Return | Fwd. P/BV | 10 yr. Avg | Prem/Disc. |
| SPY | SPDR S&P 500 ETF Trust | -4.6% | 2.8 | 3.1 | -9.7% |
| QQQ | Invesco QQQ Trust | -4.6% | 4.2 | 4.8 | -12.5% |
| MDY | SPDR S&P Midcap 400 ETF Trust | -5.9% | 1.6 | 2.0 | -20.0% |
| IWM | iShares Russell 2000 ETF | -6.5% | 1.7 | 1.9 | -10.5% |
| EFA | iShares MSCI EAFE ETF | -6.0% | 1.4 | 2.0 | -30.0% |
| EEM | iShares MSCI Emerging Markets ETF | -4.8% | 1.3 | 2.3 | -43.5% |
Source: FactSet Research Systems and ETF Research Center.
CHART 1: iShares Emerging Markets ETF (EEM) Historical P/BV Multiple

Source: ETF Research Center
All 11 sectors fell last week. Energy saw the biggest decline of 9.1%, while Consumer Staples held up best, losing just 2.1%. Like the broad benchmarks above, most sectors trade at a discount to their 10 year average P/BV ratios. The exception is Utilities, which garner a 10% premium.
TABLE 2: Major Sectors: Weekly Total Returns and Valuation Update
Week ending September 23, 2022
| Ticker | Fund | Return | Fwd. P/BV | 10 yr. Avg | Prem/Disc. |
| XLC | Communication Services Select Sector SPDR* | -5.6% | 1.8 | 2.8 | -35.7% |
| XLY | Consumer Discretionary Select Sector SPDR | -7.1% | 5.4 | 6.7 | -19.4% |
| XLP | Consumer Staples Select Sector SPDR | -2.1% | 4.6 | 4.9 | -6.1% |
| XLE | Energy Select Sector SPDR | -9.1% | 1.7 | 2.0 | -15.0% |
| XLF | Financial Select Sector SPDR | -5.6% | 1.1 | 1.3 | -15.4% |
| XLV | Health Care Select Sector SPDR | -3.3% | 3.3 | 4.1 | -19.5% |
| XLI | Industrial Select Sector SPDR | -4.5% | 3.4 | 3.9 | -12.8% |
| XLB | Materials Select Sector SPDR | -5.6% | 2.0 | 2.7 | -25.9% |
| XLRE | The Real Estate Select Sector SPDR* | -6.3% | 2.8 | 3.6 | -22.2% |
| XLK | Technology Select Sector SPDR | -3.6% | 4.9 | 5.3 | -7.5% |
| XLU | Utilities Select Sector SPDR | -3.0% | 2.2 | 2.0 | 10.0% |
Source: FactSet Research Systems and ETF Research Center. *Note: Fewer than 10 years of valuation history available.


