Money continued to flow into ETFs in March, picking up from February with a continued preference for higher-beta plays like small caps and foreign stocks. Bond investors however appeared more cautious where they put new money to work.
Welcome to the April 2021 issue of Flow Charts, a monthly summary of fund flow data from our ETF universe. As a reminder, we take a slightly different approach than the typical fund flow analysis by stripping out the short interest portion of each ETF to arrive at a “Net Long” figure for dollar flows.
Since authorized participants can create new ETF shares simply to meet demand from short sellers, such “inflows” should not be equated with bullish investors putting new money to work on the long side. (Likewise, “outflows” that reflect the closing out of short positions should not be seen as bearish.)
By netting out these short interest positions, we believe this presents a more accurate picture of where other investors are truly bullish, and where they are bearish. That said, here is what the data revealed for the month of March 2021.
Equity flows continued to favor higher-beta plays like small caps and foreign stocks, while bond investors grew more risk averse
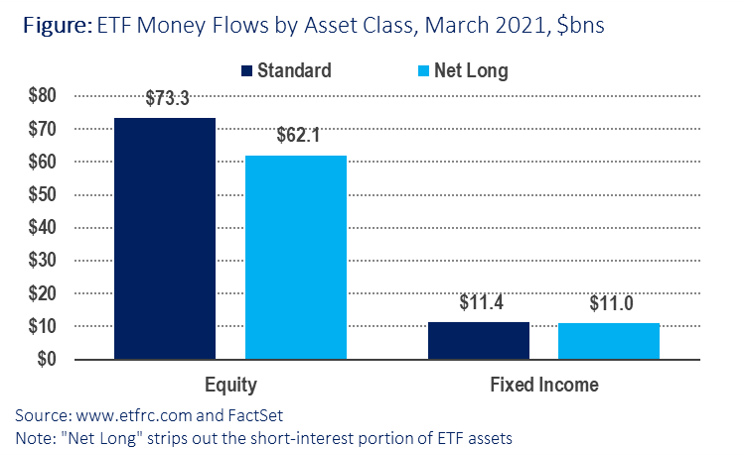
Overall “Net Long” ETF inflows were $62 billion in March, an increase from just under $44 billion during February, and the highest dollar amount since November 2020. Short interest as percentage of assets under management (AUM) for equities was 11.9%.
Net long flows into bond funds were $11 billion, and short interest was at 9.1%. As a percentage of starting assets under management (AUM), net flows into equity ETFs were 1.6%, and 1.1% for fixed income funds.
Three of the top five ETFs measured on net inflows were from Vanguard:
- Vanguard Total Stock Market ETF (VTI, +$4.7 billion net inflows)
- iShares Core MSCI Emerging Markets ETF (IEMG, +$4.6 billion)
- Vanguard S&P 500 ETF (VOO, + $4.3 billion)
- iShares Russell 2000 (IWM, +$3.4 billion)
- Vanguard FTSE Emerging Markets ETF (VWO, +$2.8 billion)
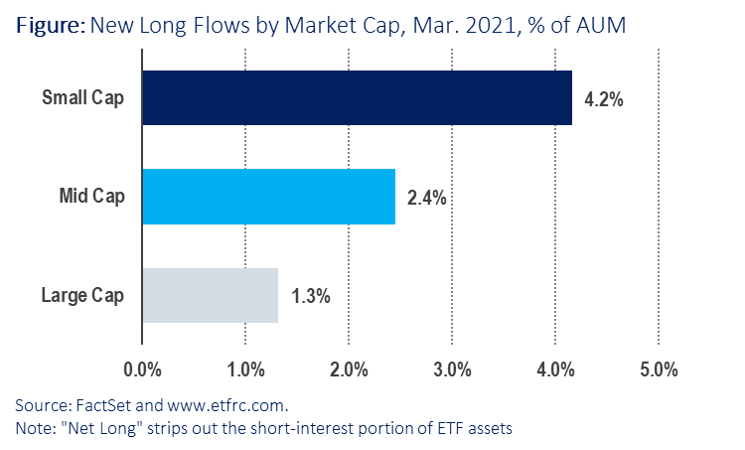
The recent shift in favor of mid- and small-cap stocks continued in March, even though large caps–comprising about 80% of total equity ETF AUM–received the largest dollar amount of new money. But in terms of flows as a percentage of AUM, small cap ETFs gained 4.2%, followed by mid caps with a 2.4% gain. New money put to work in large caps was “only” 1.3% of starting AUM, still a very respectable number.
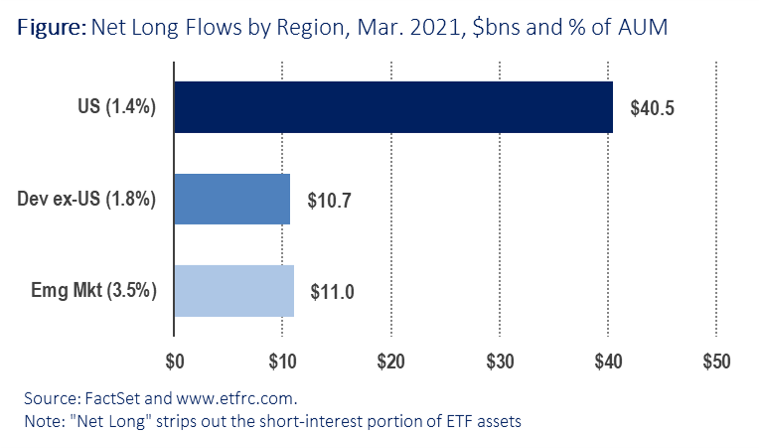
At the risk of sounding like a broken record, March also saw a continued shift in favor of international stocks, particularly those in Emerging Markets. As a percentage of AUM, net flows into Emerging Market ETFs were 3.5%, compared to 1.8% for Developed Markets outside the U.S., and 1.4% for domestic stocks.
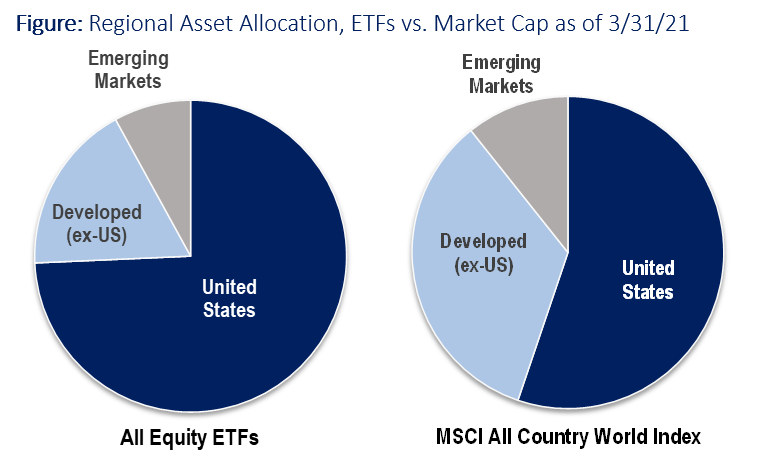
Note however that ETF investors as a whole remain dramatically underexposed to foreign shares compared to the cap-weighted MSCI All Country World Index, which is tracked by the iShares MSCI ACWI ETF (ACWI). Foreign stocks account for about 44% of global market cap in the ACWI, but assets allocated to foreign shares by ETF investors was only 26% of the total equity allocation as of March 31, 2021.
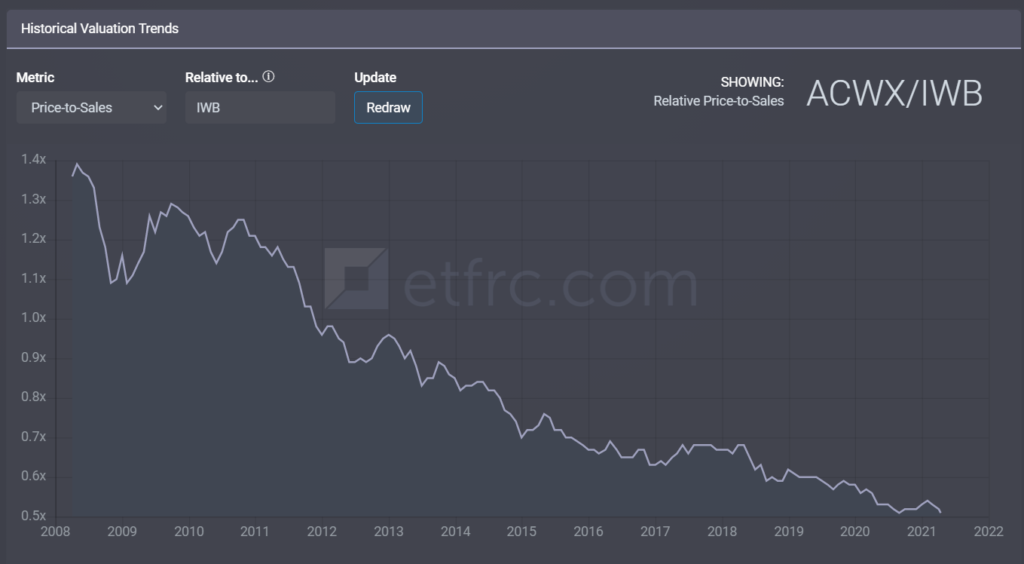
As a matter of valuation, foreign shares in general haven’t been this cheap relative to their U.S. counterparts in at least the 13 year history we have going back to 2008. Specifically, stocks in the iShares MSCI ACWI ex US ETF (ACWX), a broad measure of foreign stocks, trade at 50% discount to their counterparts in the iShares Russell 1000 ETF (IWB) in terms of price-to-sales (chart below), as well as a roughly 30% discount in terms of price-to-earnings.
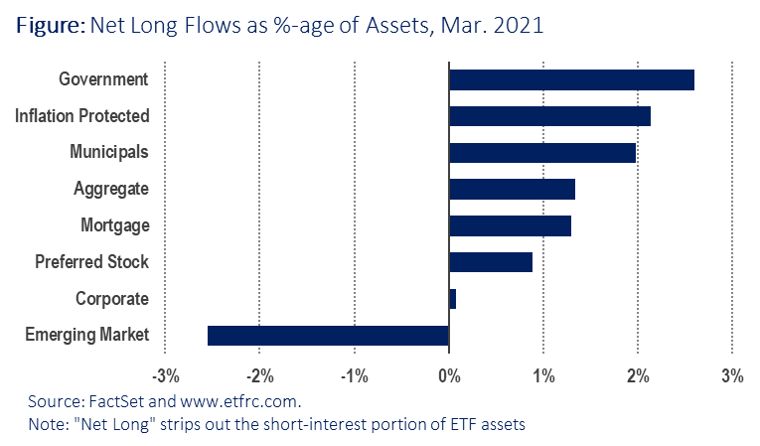
Finally, we turn our attention to the fixed income segment of the ETF world, which makes up about 18.6% of total AUM. Unlike in the equity space (79.9% of ETF AUM), bond investors turned more cautious in March, putting new money to work in Treasuries and TIPS (inflation protected Treasuries), while yanking money from Emerging Market bond funds. Meanwhile flows into Corporate bond funds were negligible.
