Despite the S&P 500’s decline in January, investors poured new money into higher-beta areas across the board, as the pace of inflows picked up steam compared with December.
Welcome to the 5th issue of Flow Charts, a monthly summary of fund flow data from our ETF universe. As a reminder, we take a slightly different approach than the typical fund flow analysis by stripping out the short interest portion of each ETF to arrive at a “Net Long” figure for dollar flows.
Since authorized participants can create new ETF shares simply to meet demand from short sellers, such “inflows” should not be equated with bullish investors putting new money to work on the long side. (Likewise, “outflows” that reflect the closing out of short positions should not be seen as bearish.)
By netting out these short interest positions, we believe this presents a more accurate picture of where other investors are truly bullish, and where they are bearish. That said, here is what the data revealed for the month of January 2021.
Despite the S&P 500’s decline in January, ETF investors poured new money into high-beta plays across the board
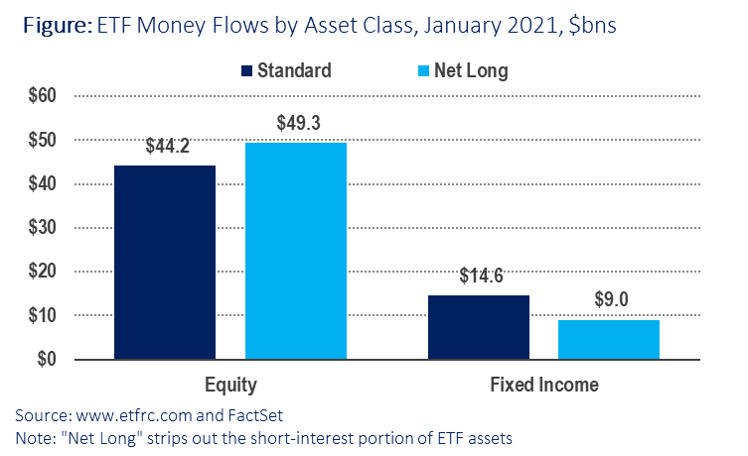
Overall “Net Long” ETF inflows were $57.8 billion in January, an increase of 34% over December. “Net Long” flows for equities exceed flows measured the traditional way by about $5 billion, as short interest in the asset class declined from 11.9% of shares outstanding to 11.6%. But short interest in fixed income ETFs rose from 6.9% to 7.4%, resulting in net long flows of $9 billion versus $14.6 billion measured the traditional way. As a percentage of starting assets under management (AUM), net flows into equity ETFs were 1.3%, and 0.9% for fixed income funds.
The top three ETFs for net inflows in January each reflected a higher-beta segment of the market:
- iShares Russell 2000 ETF (IWM, +$6.5 billion net inflows)
- Financial Select Sector SPDR (XLF, +$4.5 billion)
- iShares Core MSCI Emerging Markets ETF (IEMG, +$3.7 billion)
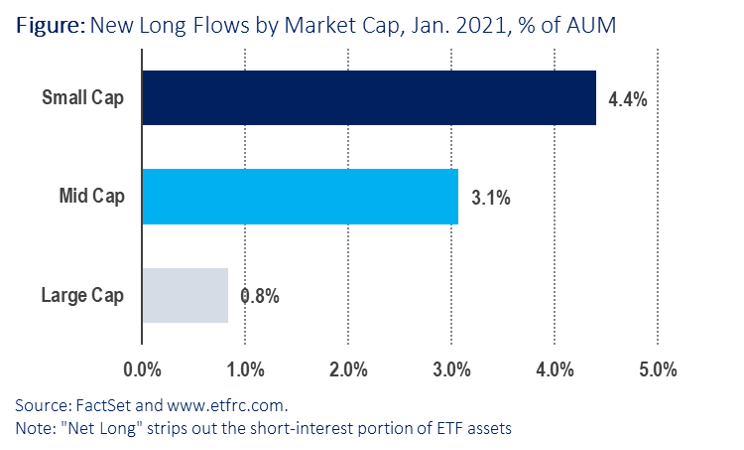
Net flows into small caps overall were a strong 4.4% of starting AUM, compared with 3.1% for mid caps and just 0.8% for large cap stocks, reflecting investors’ preference for this higher-beta segment of the market. These moves mirrored the underlying performance of each segment, where small caps as represented by the iShares Russell 2000 ETF (IWM) returned 4.8% for the month of January, while the S&P 400 MidCap SPDR (MDY) gained 1.4% and the S&P 500 SPDR (SPY) lost money, down 1.0%
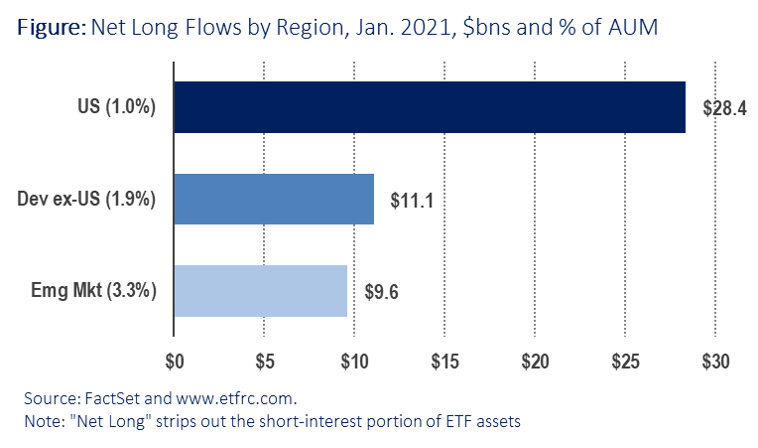
The same goes for foreign stocks, particularly in emerging markets. While domestic equity ETFs did take in the most fresh money in the absolute sense, at about $28 billion, that represents and increase of just 1.0% of starting AUM since U.S. stocks represent about 76% of equity fund assets. Developed markets outside the U.S. took in new money equal to 1.9% of AUM, while investors poured almost $10 billion into emerging market stocks, an increase of 3.3% of AUM.
These flows were also reflective of performance of the underlying asset classes, with emerging market stocks outperforming their developed market counterparts, which in turn outperformed U.S. equities.
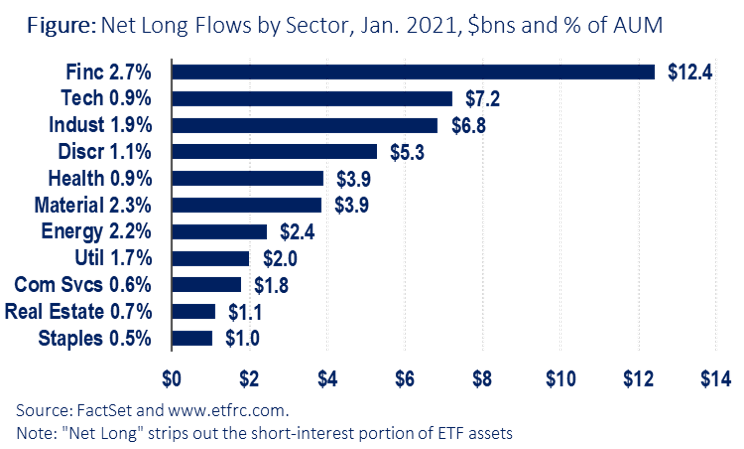
Among sectors, cyclical, higher-beta areas took in the majority of fresh money. As a percentage of starting AUM, Financials led the list at 2.7%, followed by Basic Materials (2.3%), Energy (2.2%) and Industrials (1.9%). More defensive sectors like Consumer Staples, Real Estate and Health Care were among the laggards.
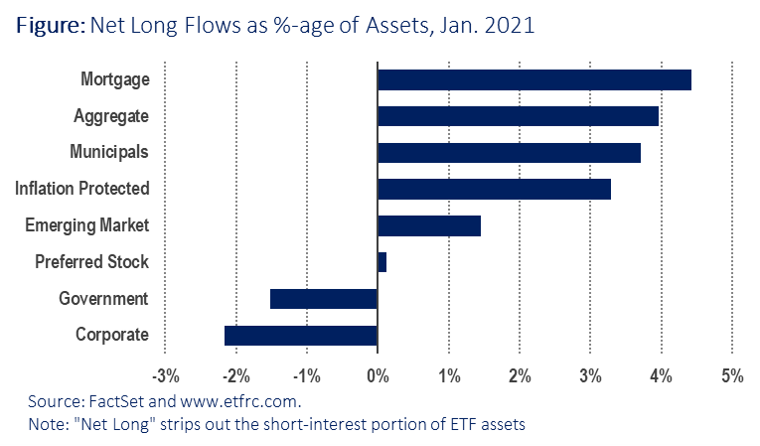
As mentioned above, short sellers increased their bets against fixed income, raising the overall short interest in bond ETFs from 6.9% to 7.4% of shares outstanding, perhaps suggesting rising concern over future inflation. Net flows within the fixed income universe lend some credence to that notion, as investors pulled money from low-yielding, interest-rate sensitive Treasuries (i.e., the “Government” segment) while allocating more new funds towards Inflation Protected ETFs as well as higher-yielding Mortgage Backed Securities that typically benefit from a steepening yield curve.
