November was a blockbuster month for money flooding into ETFs. Coinciding with the historic stock market rally, pro-cyclical plays were the biggest winners, with one notable exception: Emerging Market stocks.
Welcome to the 3rd issue of Flow Charts, a monthly summary of fund flow data from our ETF universe. As a reminder, we take a slightly different approach than the typical fund flow analysis by stripping out the short interest portion of each ETF to arrive at a “Net Long” figure for dollar flows.
Since authorized participants can create new ETF shares simply to meet demand from short sellers, such “inflows” should not be equated with bullish investors putting new money to work on the long side. (Likewise, “outflows” that reflect the closing out of short positions should not be seen as bearish.)
By netting out these short interest positions, we believe this presents a more accurate picture of where other investors are truly bullish, and where they are bearish. That said, here is what the data revealed for the month of November 2020.
Pro-cyclical ETFs were the biggest winners in November’s historic rally, with one big exception
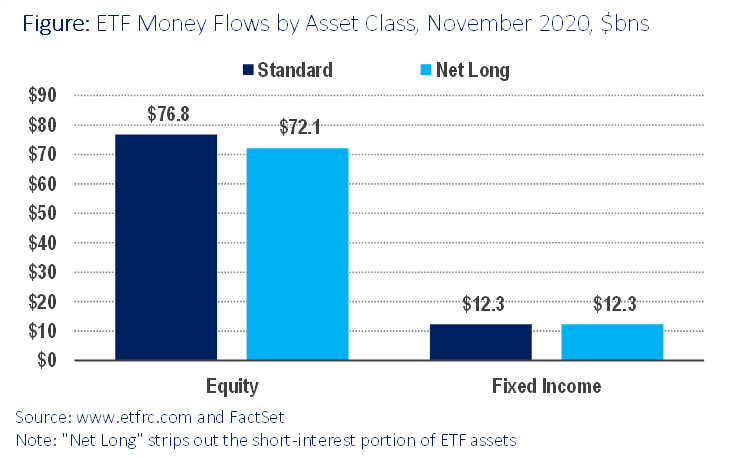
Net ETF inflows totaled a record $83.6 billion in November, with the vast majority — $72.1 billion — coming from equity ETFs, and $12.3 billion from fixed income funds. (Commodity ETFs and other asset classes registered small outflows). As a percentage of assets under management (AUM), equity net inflows amounted to an increase of 2.2%, while fixed income’s increase was a respectable 1.2%.
The top five ETFs for net inflows in November were:
- S&P 500 SPDR (SPY, +$16.8 billion net inflows)
- iShares Russell 2000 (IWM, +$5.1 billion)
- Vanguard Total Stock Market (VTI, +$5.1 billion)
- iShares Core S&P 500 (IVV, +$3.2 billion)
- Vanguard Total International Stock (VXUS, +$2.6 billion)
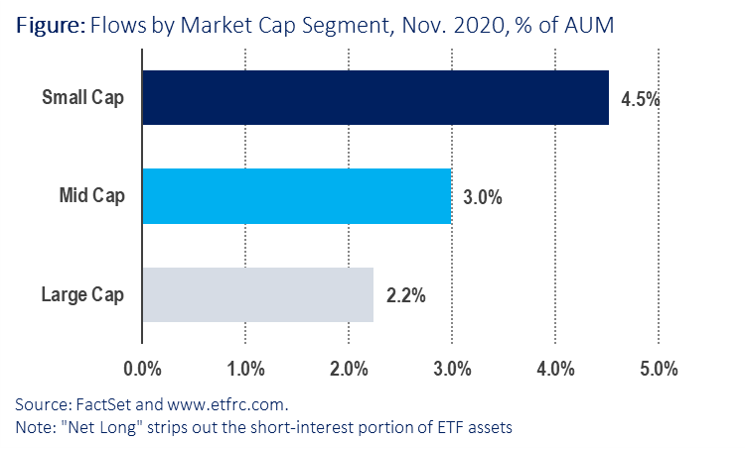
The overwhelming message visible in fund flow data broken out by both sector and market cap segmentation is one of pro-cyclicality. Economically sensitive small caps for example took in new money equal to an astounding 4.5% of starting AUM, compared to 3.0% for mid cap stocks and 2.2% for large caps. (To be sure, large caps are a much bigger portion of the overall asset allocation among equity ETFs, and they took in the larger dollar amounts in absolute terms than did either mid caps or large caps).
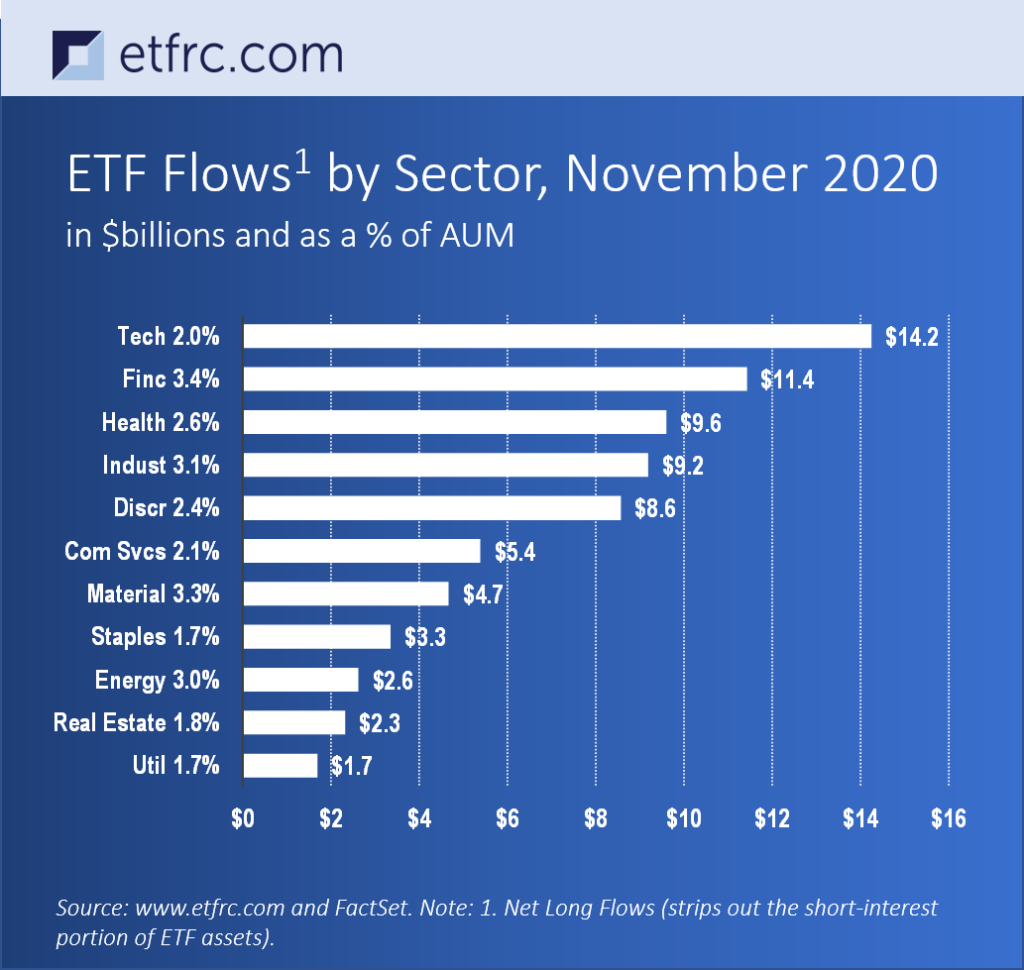
The same story holds true when one breaks down down fund flow data by sector. While Tech remains the largest sector and took in the biggest amounts in absolute dollar terms, as a percentage of AUM the biggest winners were all decidedly cyclical plays: Financials (+3.4% of AUM), Materials (+3.3%), Industrials (+3.1%) and Energy (+3.0%). Meanwhile the defensive Utilities (+1.7%), Consumer Staples (+1.7%) and Real Estate (+1.8%) sectors all took in the least amount of new money as a percentage of assets.
Worth mentioning too is that the Energy Sector SPDR (XLE) had by far the best performance of any domestic sector last month, gaining 28%, compared to 10.9% for the S&P 500 SPDR (SPY).
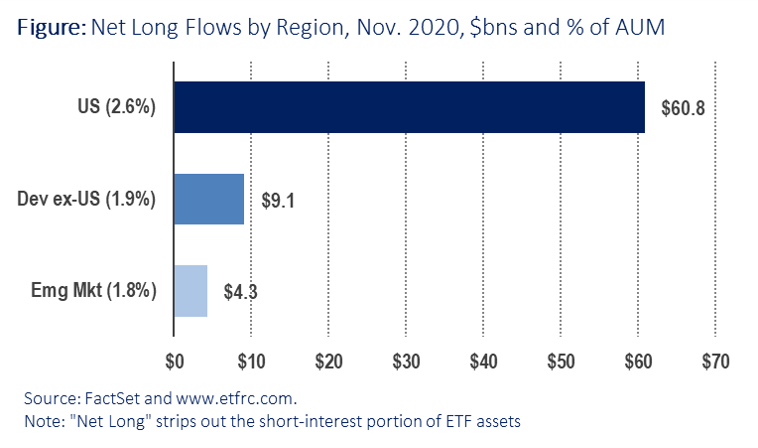
However, there was one exception to November’s pro-cyclical theme: Emerging Market stocks. These stocks tend to do well in “risk-on” environments and should have benefitted from last month’s fund flow activity.
However, net inflows into Emerging Market ETFs amounted to only 1.8% of starting AUM, compared with 1.9% for developed markets outside the U.S. and 2.6% for domestic stocks. The culprit? Short interest rose from 9.1% of emerging market assets to 9.7% over the past month.
That’s a sizeable move for an entire asset class like this, and it indicates growing caution among investors despite the segment’s good performance (the iShares Core MSCI Emerging Markets ETF (IEMG) for example gained 9.6% for November).
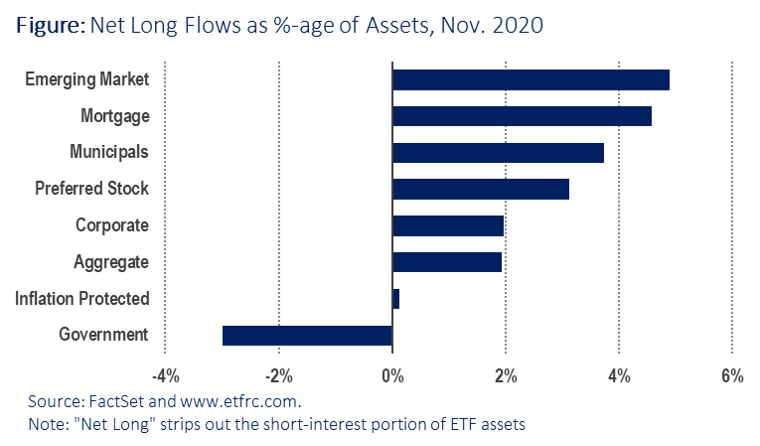
Investors’ caution over Emerging Market stocks did not however carry over to the region’s fixed income funds. There, emerging market bond funds along with other yield plays took in the lion’s share of new money as a percentage of assets, while Treasuries (shown as “Government” below) saw net outflows during November.
