Welcome to the 2nd issue of Flow Charts, a monthly summary of fund flow data from our ETF universe. As a reminder, we take a slightly different approach than the typical fund flow analysis by stripping out the short interest portion of each ETF to arrive at a “Net Long” figure for dollar flows.
Since authorized participants can create new ETF shares simply to meet demand from short sellers, such “inflows” should not be equated with bullish investors putting new money to work on the long side. (Likewise, “outflows” that reflect the closing out of short positions should not be seen as bearish.)
By netting out these short interest positions, we believe this presents a more accurate picture of where other investors are truly bullish, and where they are bearish. That said, here is what the data revealed for the month of October 2020.
Amid October’s sell-off, investors increased their allocation to fixed income ETFs
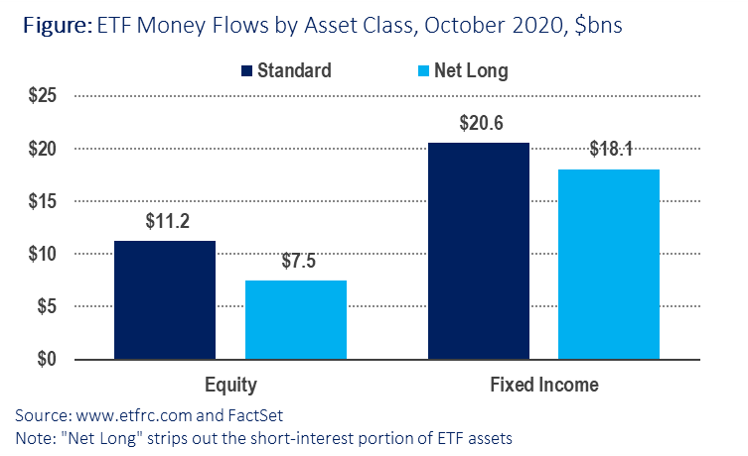
ETFs continued to hoover up cash in October, with net inflows totalling about $26.5 billion ($31.0 billion in inflows measured the traditional way). Fixed Income ETFs captured the majority of that, with net inflows amounting to $18.1 billion compared to $7.5 billion for equity funds.
The S&P 500 SPDR (SPY) by itself had a significant impact on these figures. The fund saw roughly $10.1 billion in outflows measured the traditional way. But as a favorite hedging vehicle for retail and institutional investors alike, the increase in short-interest from 16.1% to 18.4% of shares outstanding during the month means long-only investors yanked nearly $15 billion from the fund.
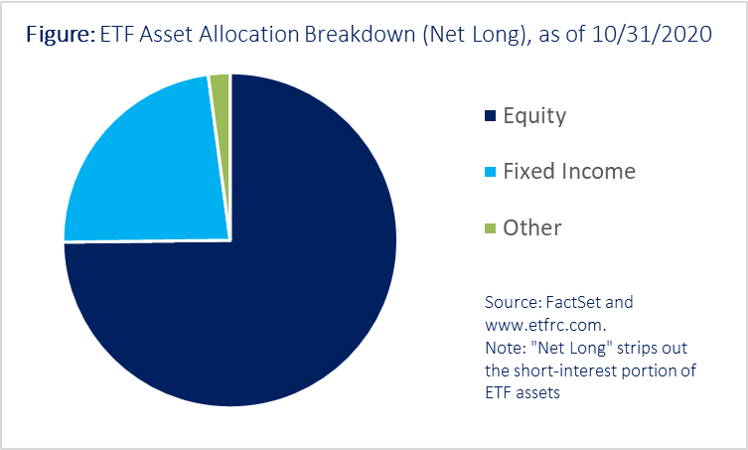
As a percentage of starting Assets Under Management (AUM), the net inflows into bond funds represented a 1.9% increase whereas the increase for stock funds was only 0.2%. This reflected investors’ increased allocation to fixed income amid October’s sell-off. As an asset class, equity ETFs account for 75% of net long ETF assets, while 23% is allocated towards fixed income ETFs and the remainder is scattered among commodity and other categories.
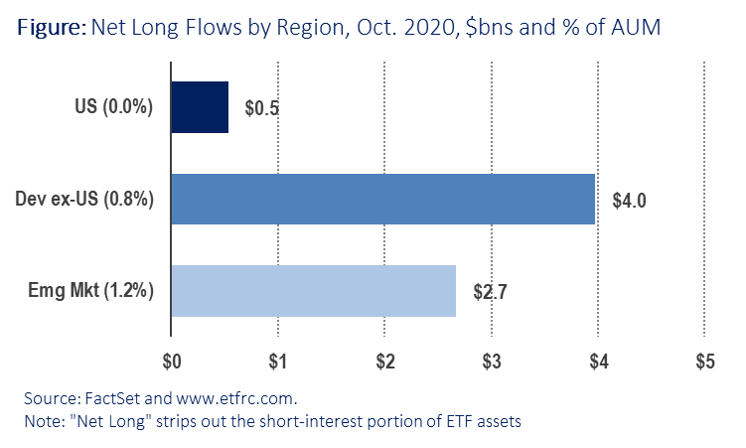
Within the equity universe, investors continued to demonstrate more enthusiasm for foreign equities, putting more cash to work in both developed and emerging markets, measured both in total dollar amounts as well as a percentage of AUM. Japan again merits a special mention (as it did last month) with an increase of 1.4% in AUM.
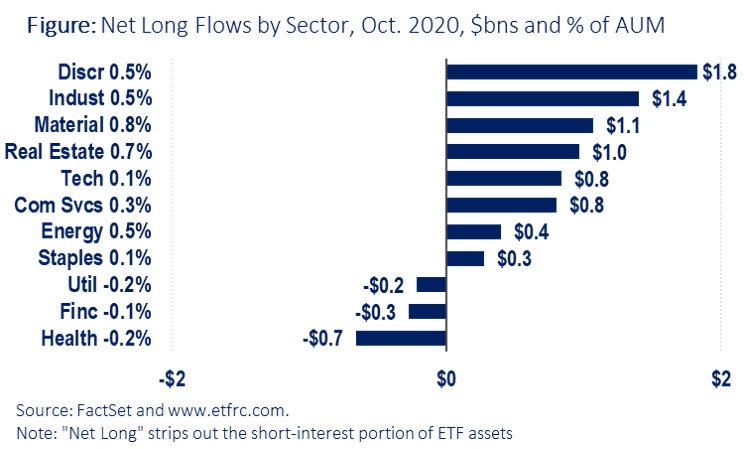
Looking into sectors there was somewhat of a pro-cyclical bias, despite October’s price declines. Consumer Discretionary, Industrials and Materials won the lion’s share of new money, while Health Care, Financials and Utilities saw net outflows. Technology, which had a rough month in terms of performance, captured net inflows equal to only 0.1% of AUM.
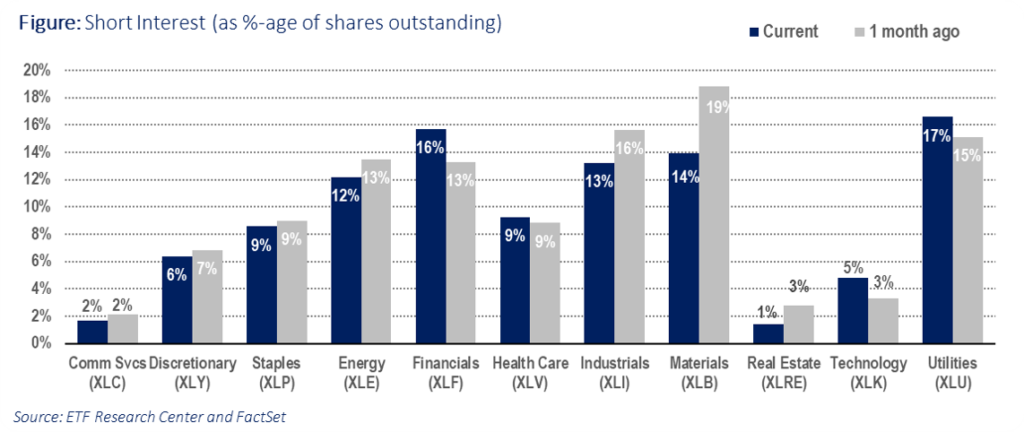
Focusing specifically on the Select Sector SPDR suite of ETFs, we significant declines in short interest for Materials (XLB) and Industrials (XLI), but noteworthy increases for Utilities (XLU), Financials (XLF) and Technology (XLK).
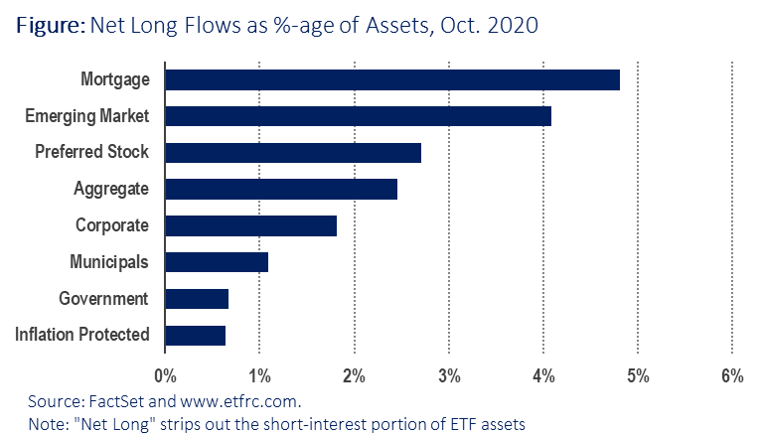
Finally, we round out our discussion of October fund flows activity by examining the fixed income corner of the ETF universe. An analysis of market segments shows that investors steered new money towards higher-yielding areas like Mortgage Backed Securities, Emerging Market Bonds and Preferred Stock funds, while as a percentage of AUM the low-yielding U.S. Treasury and T.I.P.S. garnered less interest.
