Welcome to the inaugural issue of Flow Charts, a monthly summary of fund flow data from our ETF universe. We take a slightly different approach than the typical fund flow analysis by stripping out the short interest portion of each ETF to arrive at a “Net Long” figure for dollar flows.
Since authorized participants can create new ETF shares simply to meet demand from short sellers, such “inflows” should not be equated with bullish investors putting new money to work on the long side. (Likewise, “outflows” that reflect the closing out of short positions should not be seen as bearish.)
By netting out these short interest positions, we believe this presents a more accurate picture of where other investors are truly bullish, and where they are bearish. That said, here is what the data revealed for the month of September 2020.
Overall fund flows were robust, with fixed income ETFs maintaining their edge in enthusiasm
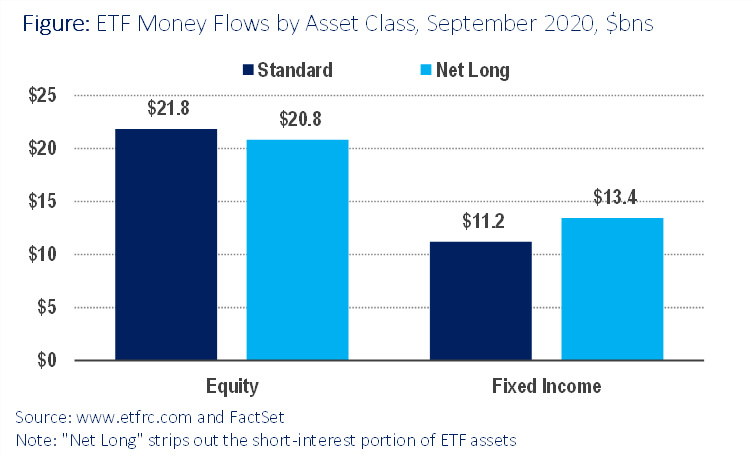
Overall fund flow activity was robust, despite the market correction. Equity ETFs saw net inflows of $20.8 billion ($21.8 billion in total inflows) with assets under management (AUM) totaling $3.5 trillion. Short interest was stable, with both the current and last month’s figure rounding to 11.8% of shares outstanding.
Meanwhile Fixed Income funds saw net inflows of $13.4 billion ($11.2 billion total), as short interest fell to 6.6% of shares outstanding versus 6.9% the previous month. Although smaller in absolute terms, flows into bond funds were more robust as a percentage of AUM, since the bond ETF universe is much smaller. Net inflows into bond funds were 1.13% of starting AUM, compared to a figure of 0.60% for equity ETFs, demonstrating investors’ continued enthusiasm for fixed income ETFs.
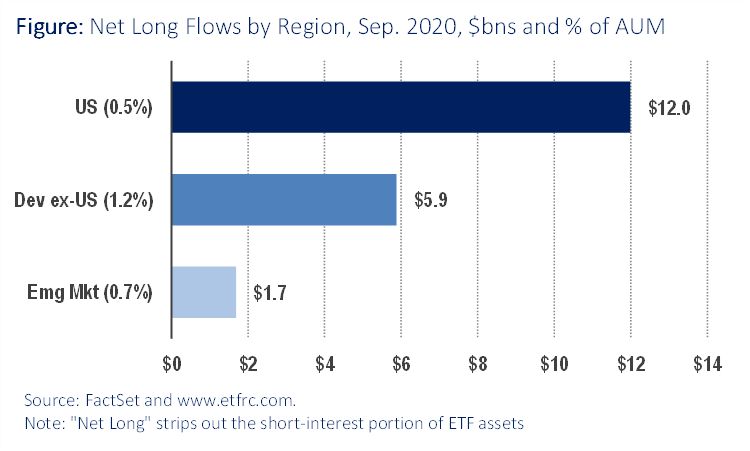
Within the equity universe, flows into U.S. equities were strongest in dollar amounts, but relative to the size of AUM investors demonstrated more enthusiasm for foreign equities. Developed foreign shares saw inflows equating to 1.2% of AUM while emerging markets took in 0.7%, compared to 0.5% for U.S. equities.
Among developed markets ex-US, European equities took in assets equal to 1.4% of AUM, while Japanese equities gained 1.1%
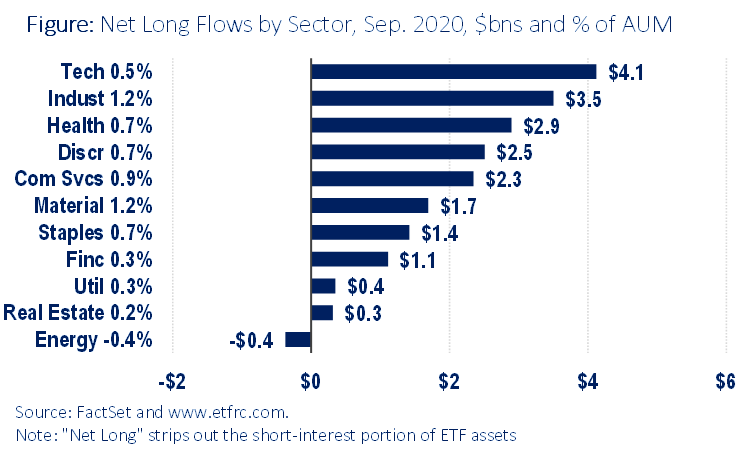
Among sectors, Technology was once again in the lead, hoovering up $4.1 billion in net new money. But cyclical plays Industrials and Materials were standouts for the flows they got relative to their asset base, both equal to 1.2% of AUM. Income plays Utilities and Real Estate saw less enthusiasm, gaining only 0.2% of AUM in new money, while Energy saw a new outflow of 0.4% of assets.
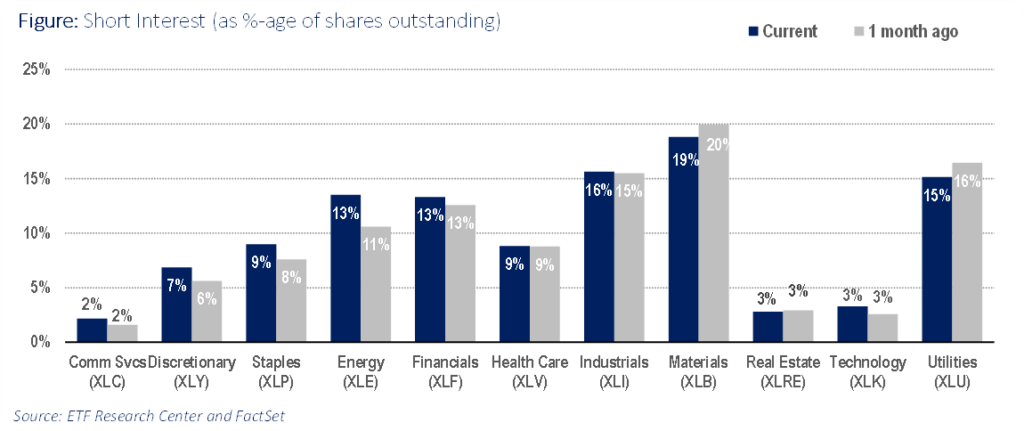
Looking specifically at the Select Sector SPDR suite of ETFs, we see that short interest was fairly stable over the last month, with the exception of the Energy Sector SPDR (XLE). That fund saw short interest rise from 11% of 13% of shares outstanding. Perhaps that’s not surprising as investors were just trying to profit from the sector’s precipitous decline of almost 15% for the month of September.
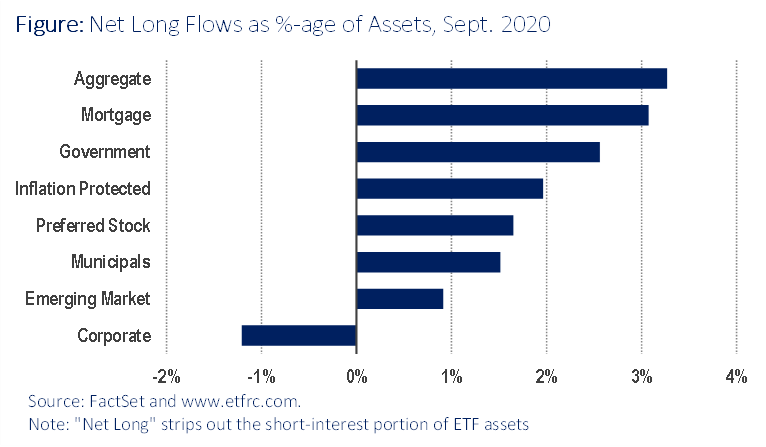
Finally, we turn our attention to the fixed income corner of the ETF universe. While overall fund inflows were robust as shown above, lower-credit risk plays including aggregate bond funds, mortgage-backed securities and Treasuries saw the biggest net inflows as a percentage of AUM, while corporate bonds saw net outflows, in concert with the pullback in equity markets. These net outflows were seen in both investment grade funds such as the iShares iBoxx $ Investment Grade Corporate Bond ETF (LQD) as well as “junk bond” funds like the SPDR Bloomberg Barclays High Yield Bond ETF (JNK).
