Beware Bargain “Headline” Fees That Can Cost You More In The End
Below is a reprint of a white paper entitled “U.S. Sector ETF Suites: A Look at Total Cost of Ownership” that examines the real cost differences between four competing domestic sector ETF lineups from Sector SPDRs, Vanguard, iShares and Fidelity. You can download the PDF version here:
Executive Summary
• Sector ETF suites enable investors to tactically allocate to sectors they believe are poised to perform well in various stages of the economic cycle. We examine the total cost of ownership (TCO) associated with four major sector ETF suites: Sector SPDRs, Vanguard, iShares, and Fidelity.
• Investors who focus on funds’ expense ratios while ignoring bid/ask spreads are missing an important part of the total cost picture and making a potentially expensive mistake. This is particularly applicable to trading vehicles like sector ETFs.
• A comparison between the Vanguard sector suite and the Sector SPDRs—the two low-cost leaders overall—shows that Vanguard’s cost advantage from its funds’ lower expense ratio is negated by wider bid/ask spreads in normal markets. In stressed markets spreads can grow much wider, negating the fee advantage several times over (Figure 1).
• The holding period required for a Vanguard sector ETF’s lower expenses to compensate for wider bid/ask spreads in normal markets is one year. If just one side of the ETF trade (purchase or sale) occurs during stressed markets, the breakeven holding period can grow to 3.2 years.

Sector Suites: An Overview
Sector ETF suites tracking traditional, market cap-weighted indices are available from four major issuers: State Street, under the “Sector SPDRs” brand; Blackrock, under the “iShares” brand; Vanguard and Fidelity (Table 1).
Sector SPDRs are the most established. The original nine funds have more than 20 years of trading history since inception in December 1998 (XLRE and XLC debuted in 2015 and 2018, respectively, coinciding with evolving sector definitions. The iShares suite came along about a year and a half later, in mid-2000, followed by Vanguard (2004) and Fidelity (2013).
The funds’ track different indices so their constituents are not identical, though there is considerable overlap. (To see the overlap between any two ETFs use this tool.) The Sector SPDRs collectively hold the constituents of the S&P 500 index of large cap stocks, divvied up according to each constituent’s sector designation under the Global Industry Classification Standard (“GICS”). Vanguard, iShares and Fidelity track similar broad, market-cap weighted indices from MSCI and Dow Jones, which are dominated by large caps but that also include some exposure to mid- and small-caps.

A More Complete Cost Analysis
Investors seem predisposed to focusing on ETFs’ expense ratios while deemphasizing other costs associated with ETF investing, which in some cases can exceed the “headline” expense number. All ETF prospectuses, for example, contain a discussion of these management fees, along with examples of how these costs might add up over time. And ETF issuers have been engaged in a well-documented “fee war” over the last few years in an effort to draw in new assets, including from competitors.
The Expense Ratio is the management fee the fund company charges shareholders. This generally fixed fee is the “headline” cost that is easy to compare between funds. But management fees are not the only costs ETF investors must bear.
ETF
investors also pay via the Bid/Ask Spread
each time they purchase or sell an ETF. This cost can vary widely across ETFs
and according to market conditions, making fund comparison more difficult.
Nonetheless it is important to consider as it can sometimes amount to more—much
more—than the expense ratio.
This is particularly applicable to funds such as
Sector ETFs, which many investors view as tactical trading vehicles as opposed
to long term, buy-and-hold investments. The more frequent the trading, the more
these costs add up. It is these two costs—Expense Ratios and Bid/Ask
Spreads—that we will examine together in evaluating the Total Cost of Ownership[1]
(“TCO”) of our four sector ETF product suites.
Expense Ratios
Table 2 lays out the average annual expense ratios of our four sector ETF suites. Three of the sector suites—SPDRs, Vanguard & Fidelity—are what we would group as “low cost” providers. Sector SPDRs have an expense ratio of 13 basis points, while the Vanguard suite averages 10.2 basis points (all Vanguard funds charge 10 bp except the Real Estate fund, which charges 12 bp). Fidelity is cheaper still at just 8.4 basis points. Meanwhile iShares charges significantly higher fees for their sector suite at an average of 42.2 basis points.
Bid/Ask Spreads
There are many things that determine an ETF’s bid/ask spread, including trading volume of the ETF, liquidity of the underlying shares, and ease of hedging by market makers. While not usually as high as an ETF’s expense ratio, the bid/ask spread varies with market conditions, just as it does with single stocks. To evaluate the bid/ask component of an ETF’s costs therefore we use an average of bid/ask spread observations over time. Table 2 shows these averages for each of our sector ETF suites.

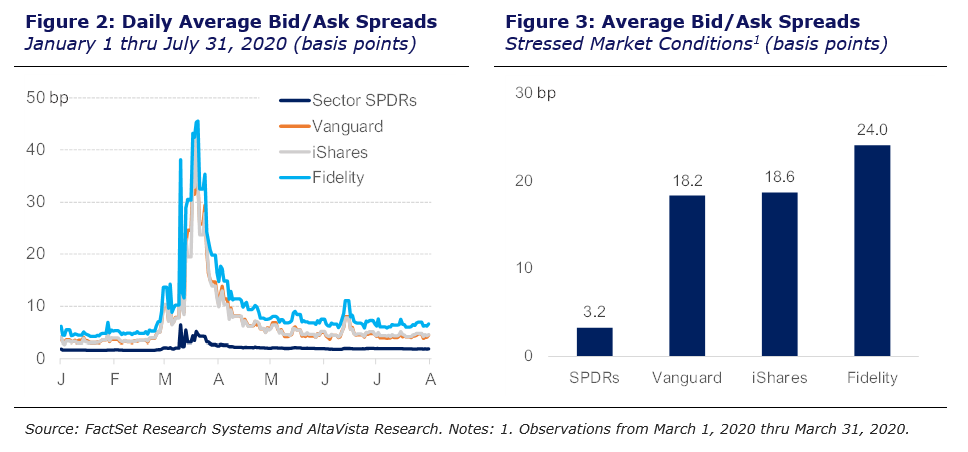
The figures above are from the month of June 2020, representing well-functioning markets when volatility was at levels well within historical norms. When volatility spikes and markets are stressed like during the COVID sell-off earlier this year—precisely the kind of environment in which sector investors might want to make a few trades—bid/ask spreads can increase dramatically.
The difference in how our four sector suites fared during this period might be eye-popping. While the Sector SPDRs saw its suite-average spread hit a maximum of 6 basis points, Vanguard funds (whose red line on the graph is mostly behind iShare’s gray line) saw spreads spike to a high of 35 basis points. iShares and Fidelity recorded even higher maximum spreads of 43 and 46 basis points, respectively (Figure 3).
Of course, most traders did not trade at the exact most disadvantageous time. To get an idea of more typical costs incurred by trading in volatile markets, we simply took an average of the daily bid/ask spreads observed during March 2020 (Figure 3). Here we see that the differences in spreads grew to be much greater than any difference in expense ratios.

TCO: Expense Ratio Plus Bid/Ask Spreads
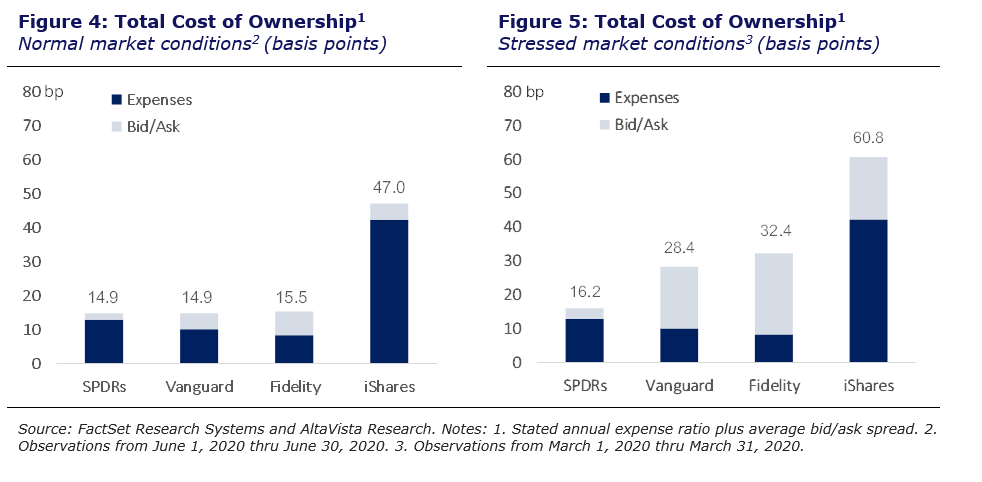
To examine the total cost of ownership for our sector ETF suites we need to add each suite’s average bid/ask spread to its average annual expense ratio. This represents the total cost an investor could expect to pay from purchasing the ETF, holding it for one year, and then selling it (we will consider other time frames later). Figure 4 shows these figures for each sector suite under normal market conditions, utilizing average bid/ask spread data from June 2020.
Under this scenario, the SPDRs and Vanguard sector suites are TCO leaders, tied with total costs of $14.90 for every $10,000 invested, followed closely by Fidelity at $15.50. iShares has far higher total costs at $47.00 per $10,000 invested.
But when market conditions become volatile, it is no longer a close contest between SPDRs, Vanguard and Fidelity. Using average bid/ask spread data from March 2020, the total cost of ownership for the Sector SPDRs suite increases about 9% to $16.22 per $10,000 invested, while TCO for the Vanguard suite nearly doubles, to $28.39. Fidelity and iShares see large increases in TCO as well (Figure 5).

Looked at another way, and focusing on the two cost leaders, we see that under normal market conditions Vanguard’s low-expense advantage is negated by its funds’ wider bid/ask spreads. And under stressed market conditions, Vanguard’s much wider bid/ask spreads completely overwhelm their lower-fee advantage (Figure 1).
Holding Period Analysis
We have seen how a fund’s bid/ask spread can affect a fund’s total cost of ownership. In the case of Vanguard and Fidelity, these suite’s wider bid/ask spreads can overwhelm their cost advantages on the expense ratio versus that of the Sector SPDRs. However, since bid/ask spreads are only incurred when trading, the longer an investor holds a fund the more important its expense ratio becomes to the TCO picture, and the less important bid/ask spreads become.
So, what time horizon does an investor need to have in order to make holding a lower-fee/higher-spread ETF cheaper in terms of overall costs, versus a higher-fee/lower-spread competitor? We compared the Vanguard and Sector SPDRs suites—the two closest competitors in terms of overall costs—under two scenarios.
In the first scenario, we assume bid/ask spreads that reflect normal market conditions. In the second, we assume an entry trade under volatile market conditions with the elevated bid/ask spreads that accompany them, but we assume market conditions have returned to normal by the time we go to sell.
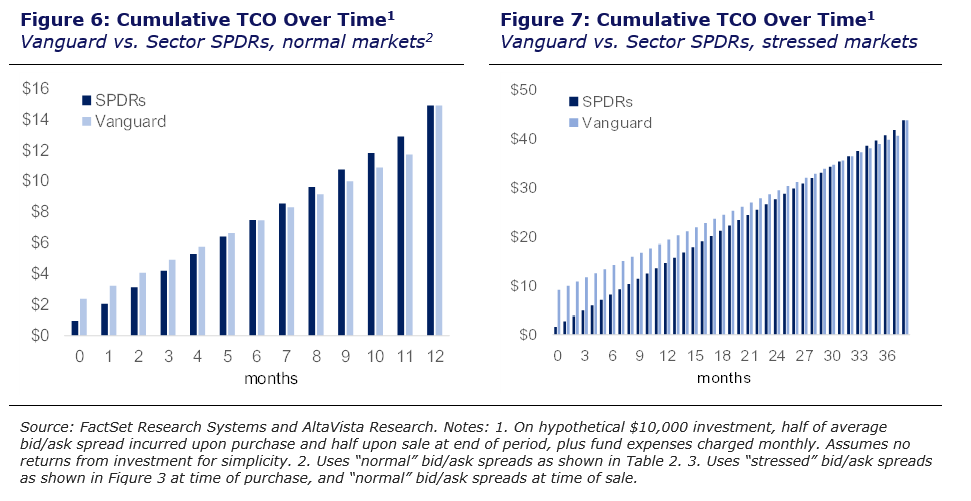
In the first scenario, as we enter into an initial $10,000 investment, we will expect to have paid about $0.96 to purchase the Sector SPDR ETF (i.e., half of the Sector SPDRs’ average bid/ask spread of 1.9 basis points) and about $2.37 for the Vanguard fund (half of Vanguard funds’ average spread of 4.7 basis points). Thereafter, fund expenses will start to add up at a rate of about $1.08 per month for the Sector SPDR fund but just $0.85 per month for the Vanguard fund.
After six months, total costs incurred from owning either of the funds is equal. However, any gains in the account are still unrealized. Investors need to hold the funds for another six months in order for savings on Vanguard’s lower expense ratio to compensate for the higher costs expected to exit the trade. Overall, then, the holding period required for the Vanguard sector funds to gain a TCO advantage over the Sector SPDRs is at least one year under normal market conditions (Figure 6).

That holding period lengthens dramatically if just one side of the trade takes place under volatile, stressed market conditions. In the second scenario, the cost to purchase the Sector SPDR ETF is estimated to be about $1.61 (i.e., half of the Sector SPDRs’ “stressed market” bid/ask spread of 3.2 basis points). For the Vanguard fund however, that cost is expected to rise to about $9.10 (half of the 18.2 basis point spread).
It will take 32 months for the Vanguard fund’s expense ratio to compensate for that initial “hit” from the bid/ask spread, and an additional six months to compensate for the expected costs of exiting the trade, assuming market conditions and spreads have returned to normal levels by then (Figure 7). This breakeven holding period then is 38 months—more than three years!
Parting Thoughts
Investors are remiss to neglect bid/ask spreads when evaluating ETF costs. This is particularly true with tactical trading vehicles like sector funds. Examining the sector product suites from major ETF issuers, we found that wider spreads can negate any cost advantage on the expense side even in normal market conditions. In especially volatile conditions it may take years to overcome the “hit” from just one trade made with wide spreads. For most investors who are likely to trade at least once a year, the Sector SPDRs remain the total cost leader among sector suites.
[1] Many analysts also consider Trading Commissions and Tracking Error part of the ETF Total Cost of Ownership. However, they are omitted from this analysis for several reasons. Many brokers now offer commission-free ETF trading; and tracking error is neither a cash cost nor does it have a directional indicator (beating a benchmark by 1% “costs” the same as trailing a benchmark by 1%).


