People usually wait until the 4th quarter to think about tax-loss harvesting, but with the markets down so dramatically on the Coronavirus pandemic investors are likely have plenty of paper losses which they could “lock in” for tax purposes, thereby partially offsetting their investment losses. The problem with this of course is that if you sell your investments you will also miss out on any gains from a recovery.
In order to stay invested, investors need to sell investments at a loss and then buy back into the market without running afoul of the IRS “Wash Sale” Rule, which prohibits an investor from booking tax losses if they purchase a “substantially similar security” within 30 days of the sold security.
It’s easy for ETF investors to lock-in tax losses while staying invested
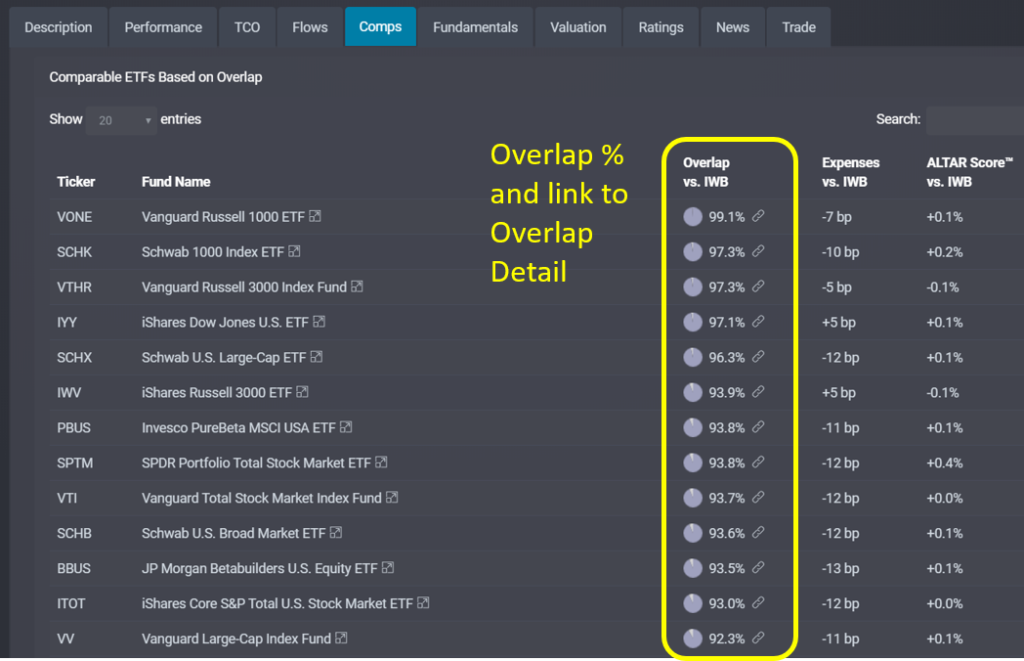
For ETF investors this is easy to do, and by using some of the tools on ETF Research Center, investors may even be able to swap into funds with lower costs and/or better appreciation potential. The first stop should be the ‘Comps’ tab on any Fund Focus page, which provides a list of Comparable ETFs based on the overlap in underlying holdings.
For example, the iShares Russell 1000 ETF (IWB) has 81 ETFs with 50% or greater overlap in underlying securities. At the top is of course the competing Vanguard Russell 1000 ETF (VONE), which is 7 bp cheaper than IWB and has an ALTAR Score™ (our rating of an ETF’s overall investment merit) of 0.1% better. Scroll down the list a bit further and you’ll find the less-widely-held SPDR Portfolio Total Stock Market ETF (SPTM) with about 94% overlap. With an expense ratio of just 3 bp it is 12 bp cheaper than IWB, and enjoys and ALTAR Score™ that is 0.4% higher.

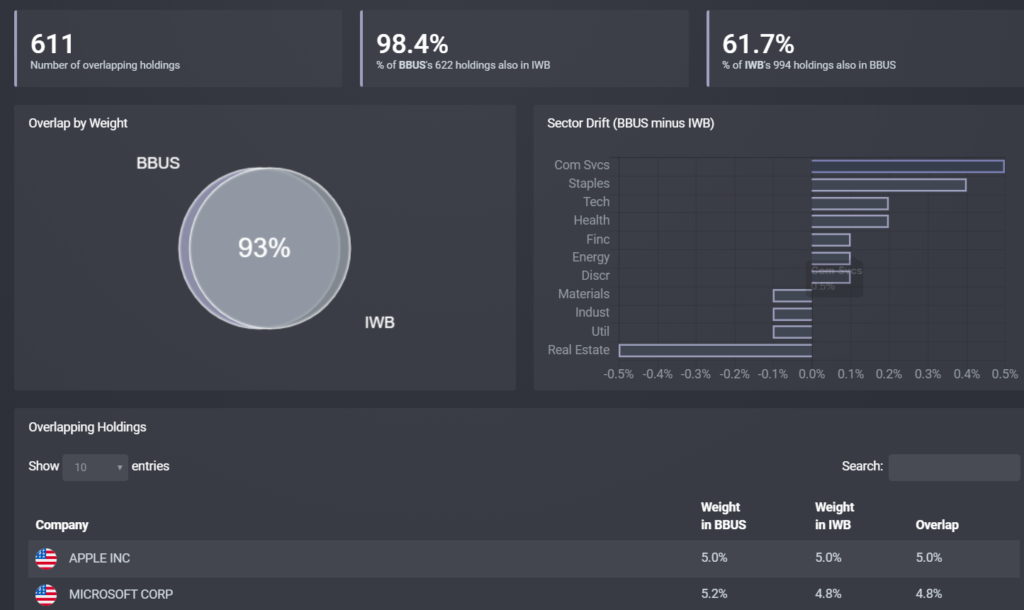
Second, click through to the overlap detail page by touching the link icon (next to the overlap percentage shown for each comparable ETF). This will show you not only the top overlapping positions but also where the two funds have the biggest difference, both in terms of sector balance and individual securities. Make sure that you are comfortable with these differences.
For example, SPTM is a bit heavier on Industrials and Financials but lighter on Tech compared with IWB, although the differences in absolute percentage terms are less than 1% each. In contrast, the J.P. Morgan Betabuilders U.S. Equity ETF (BBUS)—also with about 94% overlap verus IWB—skews more towards Communication Services and away from Real Estate, which may or may not be to your liking.

The third tool for selecting replacement ETFs is our relative performance charts. This is especially important as you move further down the list of Comps, with less overlap to the fund you’re looking to replace. Click on the Performance tab of any Fund Focus page and enter the ticker symbol of the potential replacement fund in the “comp ticker” text box and hit Redraw (you can also specify a custom date range).
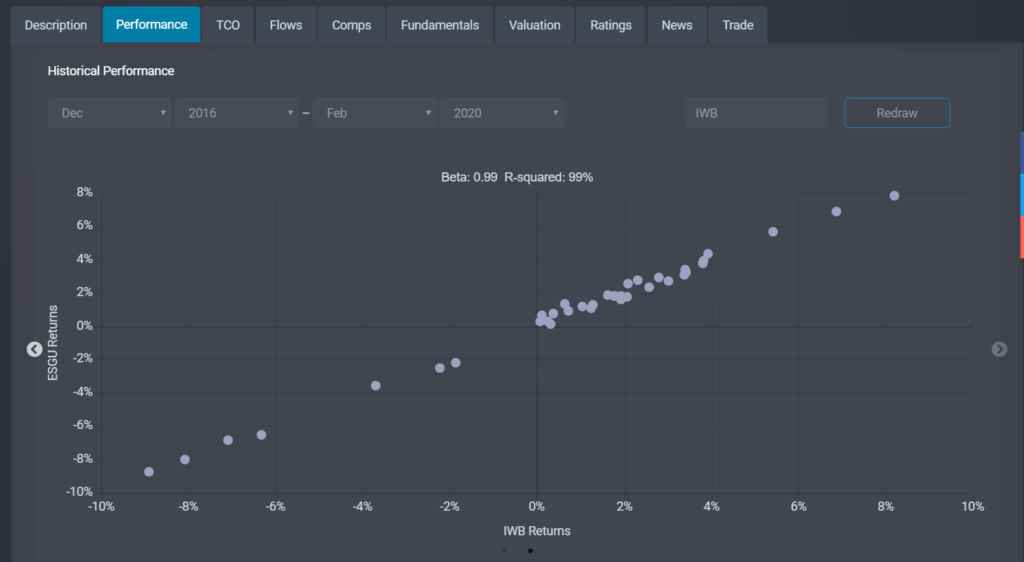
You’ll see a chart showing the relative performance of both funds over the data range queried, but if you swipe left you’ll also see a scatter plot of monthly returns, including the Beta and R-squared values resulting from conducting a regression analysis between the two series.
Perhaps you’re thinking of moving into an ESG fund, and find that iShares MSCI USA ESG Optimized ETF (ESGU) might fit the bill as a replacement. It has the same expense ratio, but only 70% overlap with IWB. However, regression analysis between the two shows an R-squared value of 99% with a Beta of 0.99, meaning it is likely to perform very similarly to IWB in any rebound.

As with any ETF, we encourage you to look at the underlying fundamentals and valuations of each potential replacement, and also see how it affects your overall portfolio’s asset allocation and investment characteristics, which you can do with our Portfolio Builder tool. Sign up for a free trial here.


