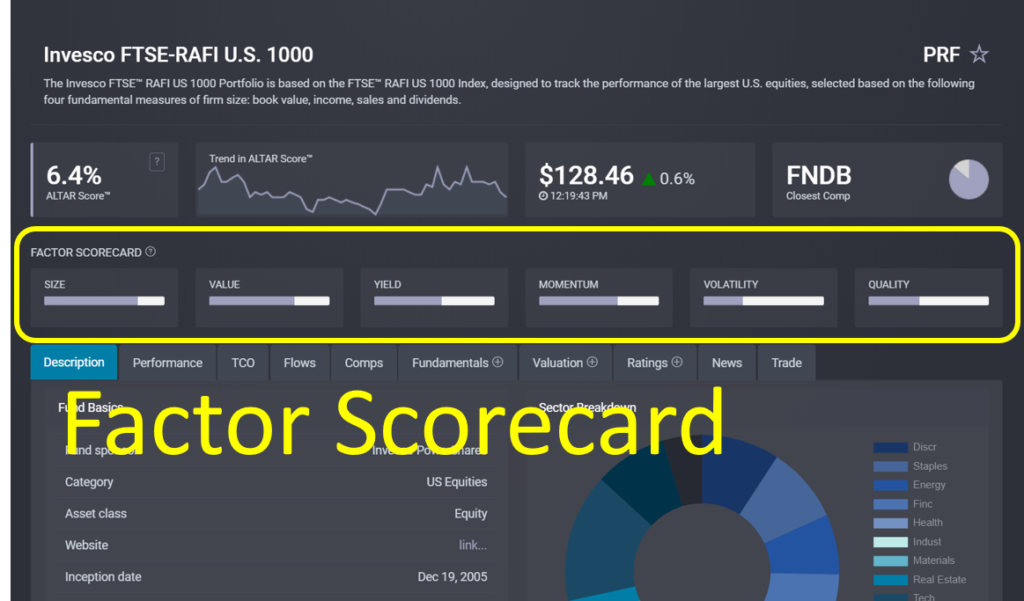
Factor investing is a widely used investment strategy that seeks stocks with certain desirable characteristics in the belief that these will lead to superior returns over time. Six widely recognized factors are Size (i.e., market cap), Value, Yield, Momentum, Quality and Volatility.
Naturally, there’s an ETF for that! Issuers offer dozens of funds using one or more factor strategies. Unfortunately, factors aren’t always easily defined, so evaluating these funds and comparing competing funds from different issuers can be challenging.
What exactly constitutes “Value” or “Quality”? Differences between index providers in how they select stocks for inclusion in a particular factor fund can result in very different fund compositions. For example, the iShares MSCI USA Quality Factor ETF (QUAL) has only 46% overlap with the Invesco S&P 500 Quality ETF (SPHQ). Even where there are generally accepted definitions such as with Volatility, differences in measurement time frames or selection universe result in rather divergent portfolios.
Our new Factor Scorecard helps investors evaluate and compare funds by establishing consistent and we believe non-controversial, “middle-of-the-road” definitions for each factor, and then ranking an ETF’s factor score against all other ETFs in the same broad category. (Our equity fund categories are U.S., International, Emerging Market and Global equities).

Rankings reflect each fund’s percentile rank within its category’s normally distributed range of values for a given factor. Our definitions for each factor are described below.
Size
Based on the weighted-average market cap (WAMC) for the underlying constituents, the graph for the Size Factor is broken into three equal buckets for Small Cap (<$2 billion), Mid Cap ($2-10 billion) and Large Cap (>$10 billion) stocks, with the upper-bound of the Large Cap being the largest WAMC for that category. The specific value shown on the graph corresponds to the appropriate market cap bucket and the ETF’s WAMC as a percentage of that bucket’s range.
As an example, an ETF with a WAMC of $6 billion—in the middle of the $2-10 billion range of the middle bucket (mid-caps), would be shown as 50% on the Size Factor graph.
Value
An equally-weighted ranking of the four major valuation multiples: price-to-earnings (P/E), price-to-sales (P/S), price-to-book value (P/BV) and price-to-cash flow (P/CF), each using the forecast figure for the next 12 months. These rankings are calculated in inverse order, since lower multiples imply more “value.”
Yield
Dividend yield based on the 12 month forward dividends per share (DPS) forecast for an ETF, ranked against all other funds in the category.
Momentum
Six-month total returns, ranked against all other funds in the category. Some Momentum ETFs may measure a longer or shorter period, or measure momentum among a more narrow universe, and therefore may not rank very highly under our definition. Regardless, users can easily compare returns between any two funds over any time period they wish on the ‘Performance’ tab of any ETF’s “Fund Focus” page (ex: MTUM).
Volatility
Six-month annualized statistical volatility, ranked against all other funds in the category. A low ranking is “good” since low volatility is the investment factor being sought.
Quality
An equally-weighted ranking of three measures of quality:
- Stability/Predictability of Earnings: Specifically, we measure the coefficient of determination, or “r-squared” of the ETF’s earnings per share (EPS) trend line over time. Those with the highest r-squared values are considered most predictable, and ranked the highest.
- Debt-to-Equity: An inverse ranking, so that the least leveraged firms (those with lower debt-to-equity ratios) rate highest.
- Average Return on Equity: Uses the Average ROE figure that we calculate for every ETF, which also forms the basis for our ALTAR Score™ rating.


