Week Ending September 9, 2022
All major equity benchmark ETFs bounced higher last week, with more economically-sensitive small- and mid-cap stocks outperforming their large cap counterparts in the S&P 500 SPDR (SPY). Shares in foreign developed markets also rallied, but Emerging Markets were a laggard with EEM gaining only 0.6%.
For this week’s valuation update we look at forward Price-to-Sales ratios (P/S) versus each fund’s average over the past 10 years. In contrast to the Price-to-Earnings ratios examined last week, U.S. Large caps trade at substantial premiums to their average P/S ratios while small caps are in line with averages. (This may be defensible since margins are higher than they used to be). Meanwhile foreign stocks continue to trade a steep discounts to their long-run average P/S.
TABLE 1: Major Benchmarks: Weekly Total Returns and Valuation Update
Week ending September 9, 2022
| Ticker | Fund | Return | Fwd. P/S | 10 yr. Avg | Prem/Disc. |
| SPY | SPDR S&P 500 ETF Trust | 3.7% | 2.3 | 2.1 | 9.5% |
| QQQ | Invesco QQQ Trust | 4.0% | 3.9 | 3.2 | 21.9% |
| MDY | SPDR S&P Midcap 400 ETF Trust | 4.4% | 1.2 | 1.1 | 9.1% |
| IWM | iShares Russell 2000 ETF | 4.1% | 1.1 | 1.1 | 0.0% |
| EFA | iShares MSCI EAFE ETF | 3.3% | 1.2 | 1.5 | -20.0% |
| EEM | iShares MSCI Emerging Markets ETF | 0.6% | 1.2 | 1.7 | -29.4% |
Source: FactSet Research Systems and ETF Research Center.
Among sectors, while all 11 Sector SPDRs were up last week there was wide divergence between them. Consumer Discretionary (XLY) gained 5.8% at the high end while Energy (XLE) managed a gain of “only” 0.8% in the face of falling oil prices. Energy’s price-to-sales ratio, which is at a 23% discount to its 10 year average suggests there may be room for further upside if oil prices (and therefore Energy sector revenue) can find some support around current levels.
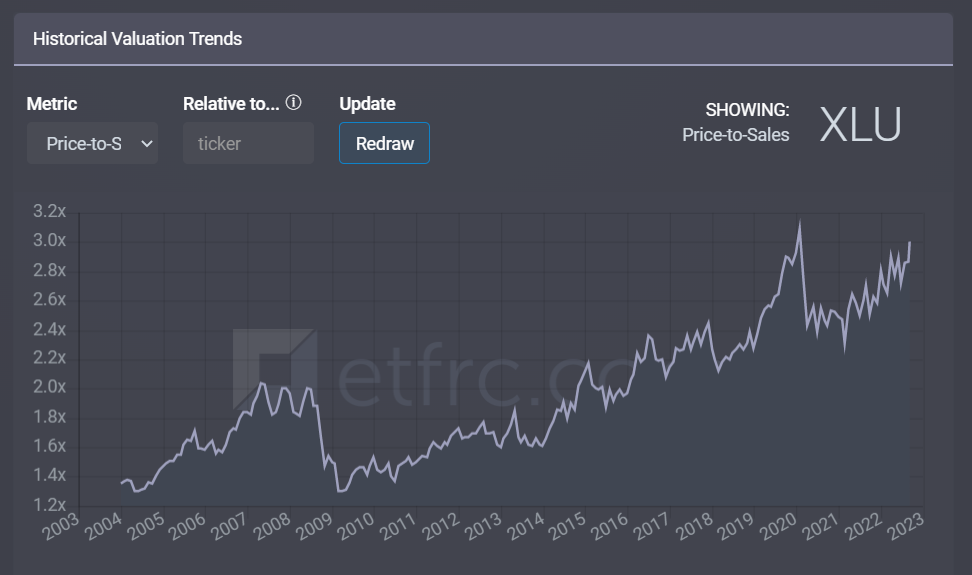
The only sector trading at a bigger price-to-sales discount than Energy is Communication Services (XLC), which is also at a P/E discount of about 13% versus its long run average (based on all available history of just over 4 years). At the other end of the spectrum, Technology (XLK) trades at a whopping 39% premium to its 10 year average P/S ratio, followed by—of all things—Utilities (XLU) at a 30% premium.
This suggests to us that investors may be pricing Utilities’ defensive nature a little too aggressively, even given all the economic uncertainty, and potentially positioning shares for a valuation correction (see Figure 1 below).
TABLE 2: Major Sectors: Weekly Total Returns and Valuation Update
Week ending September 9, 2022
| Ticker | Fund | Return | Fwd. P/S | 10 yr. Avg | Prem/Disc. |
| XLC | Communication Services Select Sector SPDR* | 3.3% | 1.8 | 2.5 | -28.0% |
| XLY | Consumer Discretionary Select Sector SPDR | 5.8% | 1.9 | 1.7 | 11.8% |
| XLP | Consumer Staples Select Sector SPDR | 2.0% | 1.6 | 1.4 | 14.3% |
| XLE | Energy Select Sector SPDR | 0.8% | 1 | 1.3 | -23.1% |
| XLF | Financial Select Sector SPDR | 4.5% | 2.3 | 2.2 | 4.5% |
| XLV | Health Care Select Sector SPDR | 4.4% | 1.8 | 1.7 | 5.9% |
| XLI | Industrial Select Sector SPDR | 3.4% | 1.8 | 1.5 | 20.0% |
| XLB | Materials Select Sector SPDR | 5.0% | 1.8 | 1.7 | 5.9% |
| XLRE | The Real Estate Select Sector SPDR* | 4.3% | 6.6 | 7.3 | -9.6% |
| XLK | Technology Select Sector SPDR | 3.3% | 5.4 | 3.9 | 38.5% |
| XLU | Utilities Select Sector SPDR | 3.7% | 3 | 2.3 | 30.4% |
Source: FactSet Research Systems and ETF Research Center. *Note: Fewer than 10 years of valuation history available.
FIGURE 1: Utilities Sector Historical Price-to-Sales Multiple
Screengrab from www.etfrc.com/XLU

Source: ETF Research Center


