etfrc.com
FUND FOCUS SCREENING PORTFOLIO BUILDER FUND OVERLAP

Charts Of The Day 1 & 2: Back to 2013 (P/Es)


Long-time readers will recognize the pair of charts below as two of our favorites, but given the market's descent into bear market territory an update is in order to help put things in perspective.

The first chart shows S&P 500 earnings per share (EPS) going back to 1950, using a logarithmic scale. The astonishing takeaway is that 99% of index EPS can be explained by one variable: the passage of time. Over the past 70 years, earnings have grown at a compound rate of 6.5% per year.

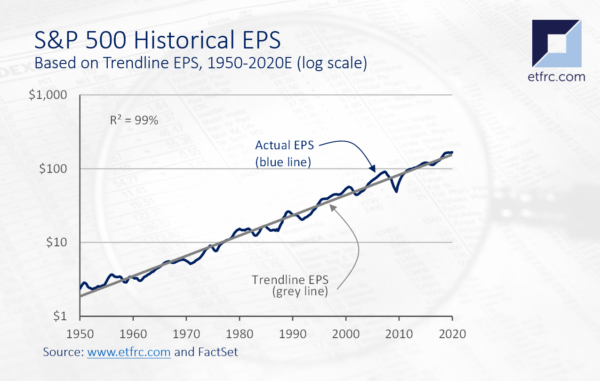
Some years earnings growth is much higher than that, while in other years earnings tank. Earnings sometimes oscillate violently around a trend line, but they do oscillate. We have no idea how badly the Coronavirus epidemic will impact earnings in 2020, but it doesn't really matter; we have a fairly good idea of what earnings will be in 2030.

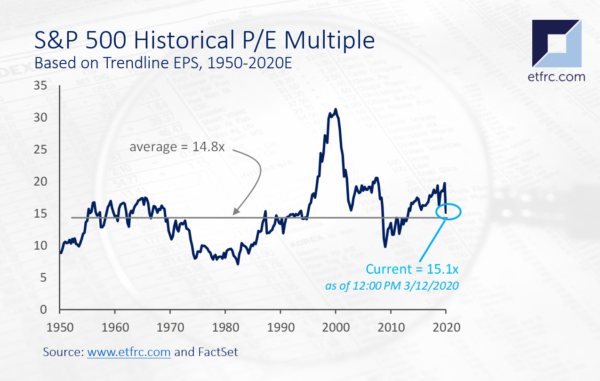
Based on this long-term trend line, as of 12:00 PM today (3/12/2020), the S&P 500 was trading at a forward P/E multiple of 15.1x (chart below), its cheapest level since March 2013, seven years ago, when still recovering from the post-Financial Crisis hangover. Back then, 10 year Treasury yields were about 1.8%, compared with just 0.81% today. (See below for more on yields).

In fact, the market's current P/E is slightly below the bottom of 15.4x seen in 2003 following the bursting of the Tech bubble and terrorist attacks of 9/11. 

Bottom Line: We can't tell you when the market will hit bottom, but if you believe that we will get through the Coronavirus and that the economy and earnings will recover--be it one quarter from now or six-- U.S. equities are at some of their most attractive levels in the past 25 years. 

For more analysis of the S&P 500 go to the S&P 500 SPDR (SPY) Fund Focus page.

Charts Of The Day 3: No-Recession Yield Curve

A yield curve constructed using the major U.S. Treasury ETFs shows that although yields are historically low, the slope is nonetheless positive, implying that bond investors do not expect an imminent recession, contrary to what turmoil in equity markets may suggest. (An inverted yield curve is often considered a warning of recession in the near future).

And there's good reason to believe that yields particularly on the long end are too low, and will need to rise, thereby steepening the yield curve.

Our friends over at DataTrek Research make a good case for why the recent flight to safety in Treasuries--which pushed yields down to historic lows--may be overdone. Examining 30-day rolling returns for the iShares 20+ Year Treasury Bond ETF (TLT) they found that the recent moves constitute a nearly 3-standard deviation event, something that has occurred only two times before in 19 years. As a result, a reversion to the mean implies that returns for TLT going forward could be rather disappointing. Read more of their excellent analysis here

Image
March 2, 2020
March 2020 Sector SPDR Analyzer
Succinct investment outlook for each of the 11 Select Sector SPDR ETFs based on a fundamental analysis of the funds’ underlying constituents.
Read more...
ETF Research Center

ETF Research Center has a complete set of tools to help investors and their advisors quickly find, analyze and compare ETFs that meet their unique investment criteria, and even build all-ETF portfolios!

Join FREE today!
AltaVista Research
P.O. Box 398256, Miami Beach FL 33239
Copyright 2020. All rights reserved.
Twitter LinkedIn
Change your subscription    |    View online